Core Web Vitals are not a checkbox exercise. They are Google's operationalized definition of page experience quality, and they feed directly into ranking signals across Search, Discover, and News surfaces. As of March 2024, the metric set shifted: Interaction to Next Paint (INP) replaced First Input Delay (FID) as the responsiveness metric. Heading into 2026, the thresholds are stable but the tooling, field data attribution, and browser behavior have all matured significantly. This article is for the practitioner who already knows what LCP stands for and wants to know exactly how Chrome measures it, where the edge cases hide, and how to move real CrUX scores at scale.
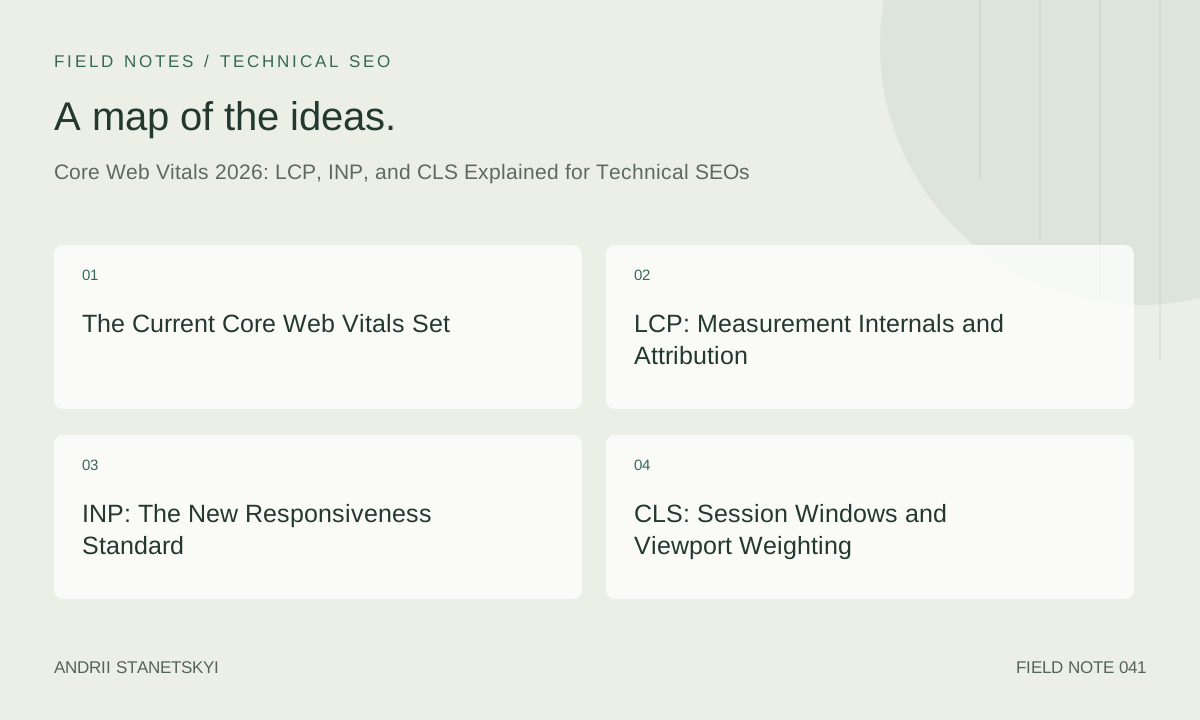
The Current Core Web Vitals Set
Google defines Core Web Vitals as the subset of Web Vitals that apply to all pages and are surfaced in tools. In 2026, there are three:
| Metric | Good | Needs Improvement | Poor | Measures |
|---|---|---|---|---|
| LCP (Largest Contentful Paint) | ≤ 2.5 s | 2.5–4.0 s | > 4.0 s | Perceived load speed |
| INP (Interaction to Next Paint) | ≤ 200 ms | 200–500 ms | > 500 ms | Overall responsiveness |
| CLS (Cumulative Layout Shift) | ≤ 0.1 | 0.1–0.25 | > 0.25 | Visual stability |
A page "passes" Core Web Vitals when all three metrics are in the Good range at the 75th percentile of field data. That 75th-percentile requirement is non-negotiable — you cannot average your way to a pass. A single slow cohort (say, mid-range Android on a congested 4G network) can drag the p75 into Needs Improvement even if desktop users see perfect scores.
Pending Metrics Worth Watching
Google has signaled interest in Smooth Animation (compositor jank) and Time to First Byte (TTFB) as future candidates. Neither is a Core Web Vital as of 2026, but TTFB appears in PageSpeed Insights as a diagnostic and correlates heavily with LCP. Treat TTFB under 800 ms as a prerequisite for LCP under 2.5 s on most architectures.
LCP: Measurement Internals and Attribution
LCP measures when the largest image or text block visible in the viewport finishes rendering. The browser uses the LargestContentfulPaint performance entry type, which is part of the Paint Timing spec. The metric finalizes when the user first interacts (scroll, click, key) or when the page enters the background.
What Elements Are Candidates
The spec considers: <img>, <image> inside SVG, <video> poster frames, elements with CSS background-image, and block-level text nodes. Inline SVG shapes without image references do not qualify. The browser re-evaluates the LCP candidate as new elements enter the viewport — the final candidate wins.
A critical nuance: the element's rendered size is capped at the viewport. A 4000×3000 hero image shrunk to 1280×720 in the viewport contributes 1280×720 to the candidate score. This means swapping a large off-screen element into the viewport via scroll will not retroactively change the LCP element — only elements visible in the initial viewport or before first interaction are candidates.
The Four Sub-Parts of LCP
The web-vitals library v3+ exposes LCP attribution through LCPAttribution. The four time slices that sum to LCP are:
- TTFB — Server latency before the first byte arrives.
- Resource load delay — Time between TTFB and when the browser starts loading the LCP resource. Caused by render-blocking scripts, parser delays, or late discovery.
- Resource load time — Network fetch duration for the LCP image or font.
- Element render delay — Time between resource load complete and paint. Caused by main thread congestion, CSS paint holds, or image decode.
// Capture LCP attribution with web-vitals.js v4
import { onLCP } from 'web-vitals/attribution';

onLCP(({ value, attribution }) => {
  const {
    element,
    url,
    timeToFirstByte,
    resourceLoadDelay,
    resourceLoadDuration,
    elementRenderDelay,
  } = attribution;

  // Send to analytics
  sendToRUM({
    metric: 'LCP',
    value,
    element: element?.tagName,
    url,
    ttfb: timeToFirstByte,
    loadDelay: resourceLoadDelay,
    loadDuration: resourceLoadDuration,
    renderDelay: elementRenderDelay,
  });
});
In practice, the single biggest lever is resource load delay. If the LCP image is discovered late — because it's in a CSS background, lazy-loaded with JS, or buried after render-blocking stylesheets — the browser queues it unnecessarily. The fix is always fetchpriority="high" on the LCP <img> tag combined with a <link rel="preload"> for images that aren't in the initial HTML.
<!-- Correct: preload + fetchpriority for LCP image -->
<link rel="preload" as="image" href="/hero.avif"
      imagesrcset="/hero-400.avif 400w, /hero-800.avif 800w, /hero.avif 1200w"
      imagesizes="(max-width: 600px) 100vw, 1200px"
      fetchpriority="high">

<img src="/hero.avif"
     srcset="/hero-400.avif 400w, /hero-800.avif 800w, /hero.avif 1200w"
     sizes="(max-width: 600px) 100vw, 1200px"
     fetchpriority="high"
     width="1200" height="630"
     alt="Hero image">
INP: The New Responsiveness Standard
INP replaced FID in March 2024. FID measured only the first input delay — a narrow metric that could look excellent on a page that became completely unresponsive after load. INP measures the worst-case interaction latency across the entire page session, using the 98th-percentile interaction when there are more than 50 interactions, or the maximum interaction otherwise.
How Chrome Measures INP
Every discrete user interaction (click, tap, keyboard key) triggers an INP measurement. Chrome timestamps the interaction start, waits for the next paint, and records the delta. The interaction lifecycle has three phases: input delay (queued behind existing tasks), processing time (event handler execution), and presentation delay (time until the next frame is committed and painted).
The key insight is that long tasks on the main thread cause input delay. If a 300 ms task is running when a user clicks, that click waits up to 300 ms before its handler even starts. This is why JavaScript execution optimization matters so much for INP.
Diagnosing INP in Chrome DevTools
Open DevTools → Performance panel → record a typical user interaction. Look for the yellow "Long Task" markers. The INP interaction will appear in the "Interactions" lane. The key diagnostic question: is the delay in input delay (pre-handler), processing (handler itself), or presentation (post-handler render work)?
// Instrument INP with attribution
import { onINP } from 'web-vitals/attribution';

onINP(({ value, attribution }) => {
  const {
    interactionTarget,
    interactionType,
    inputDelay,
    processingDuration,
    presentationDelay,
    longAnimationFrameEntries,
  } = attribution;

  console.log({
    inp: value,
    target: interactionTarget,
    type: interactionType,
    breakdown: { inputDelay, processingDuration, presentationDelay },
  });
});
Common INP Failure Patterns
- Synchronous XHR or fetch in click handlers — blocks the main thread during processing phase.
- Unscheduled React re-renders — a single state update triggers a full tree reconciliation synchronously.
- Event listener proliferation — hundreds of discrete listeners on list items instead of one delegated listener.
- Third-party scripts using
setInterval— create continuous long tasks that increase input delay.
CLS: Session Windows and Viewport Weighting
CLS was updated in June 2021 to use a session window model. The score is the maximum session window sum of layout shift scores, where a session window ends after 1 second with no shifts or after 5 seconds total. This change was significant: it moved CLS from punishing large SPAs (which accumulate many small shifts over a long session) to focusing on discrete bursts of instability.
The Layout Shift Score Formula
Each layout shift entry has two components: impact fraction (the fraction of the viewport affected) and distance fraction (the maximum distance any element moved, as a fraction of the viewport). The score for one shift is impact_fraction × distance_fraction. A shifted element covering 60% of the viewport that moves 10% of the viewport height contributes 0.6 × 0.1 = 0.06 to that session window.
User-Expected Shifts Are Excluded
Shifts caused within 500 ms of a user interaction are excluded from CLS. This means accordion expansions, tab switches triggered by clicks, and similar UX patterns do not penalize CLS if they are causally linked to input. However, lazy-loaded images that shift content 600 ms after a scroll — past the 500 ms window — will count.
// Monitor CLS with attribution
import { onCLS } from 'web-vitals/attribution';

onCLS(({ value, attribution }) => {
  attribution.largestShiftEntry?.sources?.forEach(source => {
    console.log({
      node: source.node?.tagName,
      currentRect: source.currentRect,
      previousRect: source.previousRect,
    });
  });
});
Hidden CLS Sources in 2026
- Web fonts causing FOUT — unstyled text renders, then font swaps, collapsing or expanding line heights.
- Dynamic ad slots without reserved height — GPT ad iframes inject with unknown dimensions.
- Cookie consent banners — inserted into the DOM above the fold after page paint.
- Skeleton screens with wrong aspect ratios — placeholder dimensions don't match loaded content.
CrUX, RUM, and the Lab vs Field Gap
Chrome User Experience Report (CrUX) is the canonical field data source for Core Web Vitals. It aggregates 28 days of real Chrome user sessions and is updated monthly (BigQuery) and daily (PageSpeed Insights API). CrUX data requires a minimum threshold of sessions to be included — low-traffic pages and origins often lack data entirely.
CrUX Segmentation
CrUX data is segmented by form factor (phone/tablet/desktop), effective connection type (4G/3G/etc.), and — since late 2023 — by URL-level granularity in addition to origin-level. URL-level data matters for SEO: a fast homepage does not tell you whether your category pages or product pages meet the threshold.
Use the PageSpeed Insights API to pull URL-level CrUX data programmatically:
curl "https://www.googleapis.com/pagespeedonline/v5/runPagespeed\
?url=https://example.com/products/widget\
&strategy=mobile\
&key=YOUR_API_KEY" \
| jq '.loadingExperience.metrics'
Lab vs Field Discrepancy
Lighthouse runs in a controlled environment: throttled CPU (4×), throttled network (simulated Fast 3G), single run, no warm caches, no third-party personalization. Field data captures real users with real devices, real networks, logged-in sessions, cookie banners, and personalized content. Gaps of 1–2 seconds between Lighthouse LCP and CrUX p75 LCP are normal. Gaps larger than 3 seconds usually indicate a client-side rendering issue, a login wall, or heavy third-party scripts that don't appear in Lighthouse's unauthenticated crawl.
Read our guide on reconciling lab and field data for a systematic debugging workflow.
Toolchain for 2026
web-vitals.js v4
The official Google library for measuring CWV in the browser. Version 4 adds LongAnimationFrame attribution for INP (replacing LongTask), improves CLS session window accuracy, and adds an onTTFB export. Include it from npm or CDN:
<!-- Minimal snippet for field measurement -->
<script type="module">
import { onLCP, onINP, onCLS, onTTFB } from
  'https://unpkg.com/web-vitals@4/dist/web-vitals.attribution.js';

function send(metric) {
  navigator.sendBeacon('/analytics', JSON.stringify({
    name: metric.name,
    value: metric.value,
    rating: metric.rating,
    id: metric.id,
  }));
}

onLCP(send); onINP(send); onCLS(send); onTTFB(send);
</script>
WebPageTest and Filmstrip Analysis
WebPageTest remains the most powerful waterfall tool available. For CWV work, use the Largest Contentful Paint filmstrip view to see precisely which frame the LCP element appears in. The "Opportunities & Experiments" feature lets you simulate server-side changes (e.g., adding a preload header) without modifying your production site.
Chrome DevTools Performance Insights Panel
The Performance Insights panel (distinct from the Performance panel) highlights CWV directly in the recording timeline. It marks the LCP element, flags layout shifts with their sources, and annotates long tasks contributing to INP. Enable it via the DevTools settings experiments if it's not visible in your Chrome version.
How CWV Affects Rankings
Google has confirmed that the Page Experience signal, which includes Core Web Vitals, is a ranking factor. The practical effect is modest — content quality and E-E-A-T remain dominant signals — but CWV can be a tiebreaker between topically similar pages. More importantly, mobile search surfaces the page experience badge in AMP-era contexts, and Google has explicitly stated that good CWV is a prerequisite for Top Stories eligibility on non-AMP articles.
The more compelling business case for CWV is conversion rate impact. Google's industry research consistently shows 10–25% conversion rate improvements correlating with moving from Poor to Good CWV scores. The SEO case and the UX case point in the same direction.
See our CWV impact case studies for real before/after data from e-commerce sites.
FAQ
Does Core Web Vitals affect all Google search surfaces equally?
No. CWV is confirmed as a ranking signal in organic web search. It is also a factor in Google Discover and a requirement for Top Stories on non-AMP mobile. It does not directly affect Google Ads Quality Score, though page experience (which overlaps with CWV) does factor into Ad Rank.
My Lighthouse score is 95 but CrUX shows Needs Improvement. Why?
Lighthouse is a lab tool running under simulated conditions on a fast desktop. CrUX captures real user sessions including slow Android devices, congested networks, and third-party scripts running in authenticated sessions. The most common causes of large lab-to-field gaps are: client-side rendering not captured by Lighthouse, personalization scripts that load after authentication, and heavy third-party tag manager payloads.
How long does it take for CWV improvements to appear in rankings?
CrUX data has a 28-day rolling window, updated daily in PSI. A change deployed today will take approximately 28 days to fully reflect in CrUX aggregates. Ranking changes typically lag CrUX changes by a further crawl/index cycle, meaning you should expect 4–8 weeks from deployment to ranking impact observation.
INP replaced FID in March 2024. Do historical FID scores matter?
For ranking purposes, no — FID is no longer a Core Web Vital. For historical trend analysis, FID data in CrUX remains available in BigQuery under the experimental.interaction_to_next_paint field (which began collecting INP data before the official switch). FID data is preserved in older BigQuery snapshots.
Can a single page have both Good and Poor CWV depending on the device?
Yes, and this is common. CrUX segments by form factor, so a page can have Good LCP on desktop and Poor LCP on mobile. Google uses the form factor that the user searched from to apply the CWV signal, so mobile performance is disproportionately important given mobile-first indexing.
What is the minimum traffic threshold for CrUX page-level data?
Google does not publicly specify the exact threshold, but in practice pages with fewer than roughly 1,000 monthly Chrome visits often lack CrUX data. In this case, PageSpeed Insights falls back to origin-level data, and you must rely on lab tools and your own RUM implementation for page-level insights.
Key Takeaways
- Core Web Vitals in 2026: LCP ≤ 2.5 s, INP ≤ 200 ms, CLS ≤ 0.1 — all at the 75th percentile of field data.
- INP replaced FID in March 2024. It measures worst-case interaction latency across the full session, not just first input.
- LCP attribution has four sub-parts: TTFB, resource load delay, resource load time, and element render delay. Resource load delay is usually the largest lever.
- CLS uses session windows (max 5 s, gap ≤ 1 s). Shifts within 500 ms of user interaction are excluded.
- Lab scores (Lighthouse) and field scores (CrUX) routinely differ by 1–3 seconds. Always optimize against field data for SEO impact.
- Implement
web-vitals.jsv4 for RUM with full attribution; use WebPageTest for waterfall and filmstrip analysis; use PSI API for programmatic CrUX access. - CWV improvement takes 28+ days to fully appear in CrUX, plus additional crawl/index lag before ranking changes are observable.
Conclusion
Core Web Vitals are a mature, stable signal in 2026. The thresholds haven't changed, but the tooling has sharpened considerably — especially around INP attribution with LongAnimationFrame data and LCP sub-part breakdowns in web-vitals.js v4. The practitioners who win on CWV are the ones who instrument field data properly, segment by device and page type, and treat each metric's sub-parts as independent optimization targets rather than treating "CWV" as a single monolithic score to improve. Start with your LCP resource discovery chain — it's the highest-ROI intervention on most sites, and the methodology carries directly into INP and CLS investigation.