In March 2024, Google officially promoted Interaction to Next Paint (INP) from experimental status to a Core Web Vital, simultaneously retiring First Input Delay (FID). This was not a minor metric refresh — it was a fundamentally different way of thinking about page responsiveness. FID measured one narrow slice of one interaction at the worst possible moment (first input only, delay only). INP measures every discrete interaction across the entire session and reports the worst-case response time, end-to-end. For most sites, this change exposed responsiveness problems that FID had completely hidden. This article goes deep on how INP works, how to measure and attribute it, and how to fix the patterns that consistently cause INP failures in 2026.
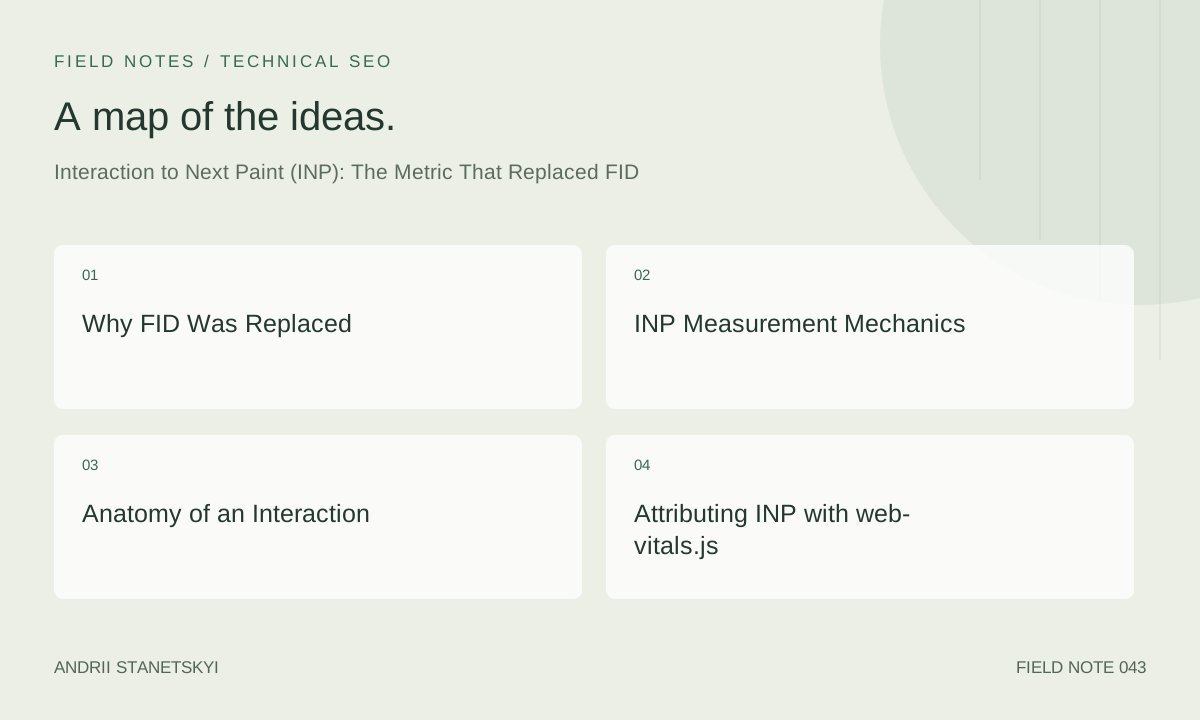
Why FID Was Replaced
FID had three structural limitations that made it inadequate as a responsiveness signal:
- First input only: FID measured the delay before the browser began processing the very first user interaction. A page could have excellent FID (fast response to the first click) but become completely unresponsive after hydration completed and all the JavaScript initialized.
- Delay only, not full duration: FID measured input delay — the queue wait time before event handler execution started. It did not measure how long the handler ran, or how long it took to render the resulting visual update. A handler that ran for 2 seconds after a 10 ms input delay would report FID of 10 ms — "Good" — despite catastrophic user experience.
- No coverage of complex interactions: Modern SPAs have most of their interaction complexity in secondary actions (filter changes, cart updates, modal opens). FID never measured these.
INP solves all three: it covers all interactions, measures the full event duration from input to next paint, and reports the worst case across the session.
| Dimension | FID (retired) | INP (current) |
|---|---|---|
| Which interactions | First interaction only | All discrete interactions |
| What is measured | Input delay only | Input delay + processing + presentation |
| Reported value | First input delay in ms | Worst-case interaction (p98 or max) |
| Good threshold | ≤ 100 ms | ≤ 200 ms |
| Poor threshold | > 300 ms | > 500 ms |
| Available in CrUX | Historical only | Yes (primary) |
INP Measurement Mechanics
Chrome measures INP using the Event Timing API. Every pointerdown, pointerup, click, keydown, keypress, keyup, touchstart, and touchend event is recorded with a high-resolution timestamp. The INP value is the interaction with the largest duration, subject to the following aggregation rules:
- Related events within a single user interaction are grouped (e.g.,
pointerdown+pointerup+clickcount as one interaction). - If there are fewer than 50 interactions in the session, INP is the maximum interaction duration.
- If there are 50 or more interactions, Chrome uses an approximation of the 98th percentile (specifically: it ignores the top 2% of worst interactions to reduce noise from accidental interactions).
The practical implication: a page visited for 30 seconds with 5 total interactions reports the worst single interaction. A page visited for 5 minutes with 200 interactions reports roughly the 196th worst interaction. Heavy-use pages (editors, dashboards, complex forms) are harder to get to Good because users accumulate more interactions and the p98 threshold is less forgiving.
Anatomy of an Interaction
INP duration = input delay + processing duration + presentation delay.
Input Delay
The time from when the user interacts to when the browser begins running event handlers. Caused by the main thread being occupied with another task. If a 300 ms JavaScript task is running when the user clicks, that click waits 300 ms before its handler starts. Long tasks are the primary driver of input delay.
Processing Duration
The time spent running all event handlers for the interaction (including propagated handlers). This is the time your JavaScript code actually runs in response to the event. Synchronous DOM reads causing layout thrashing, deep component tree traversal, and unoptimized loops inflate this phase.
Presentation Delay
The time from when event handlers complete to when the browser commits the next frame to screen. Caused by: style recalculation triggered by DOM mutations, expensive layout operations, paint and composite work. In well-optimized code, this should be under 16 ms (one frame).
Attributing INP with web-vitals.js
import { onINP } from 'web-vitals/attribution';

onINP(({ name, value, rating, attribution }) => {
  const {
    interactionTarget,      // CSS selector of the interacted element
    interactionTargetElement, // DOM element reference
    interactionType,        // 'pointer' | 'keyboard'
    interactionTime,        // Timestamp of interaction
    nextPaintTime,          // Timestamp of next paint
    inputDelay,             // ms waiting for main thread
    processingDuration,     // ms running handlers
    presentationDelay,      // ms rendering result
    longAnimationFrameEntries, // LoAF entries covering this interaction
  } = attribution;

  // Log the full breakdown
  analytics.track('INP', {
    value,
    rating,
    target: interactionTarget,
    type: interactionType,
    breakdown: {
      inputDelay,
      processingDuration,
      presentationDelay,
    },
  });

  // Log LoAF scripts for deep debugging
  longAnimationFrameEntries.forEach(loaf => {
    loaf.scripts.forEach(script => {
      analytics.track('INP_LoAF_Script', {
        source: script.sourceURL,
        function: script.sourceFunctionName,
        duration: script.duration,
        invoker: script.invoker,
      });
    });
  });
}, { reportAllChanges: true }); // Report every interaction, not just final
The longAnimationFrameEntries field is critical for production debugging. LongAnimationFrame (LoAF) entries replaced LongTask entries in web-vitals v3 because LoAF includes script attribution: the source URL and function name of the script that caused the long frame. This makes it possible to identify whether the slow frame is from your code, a third-party script, or a browser extension in RUM data — without needing to reproduce the issue locally.
Long Tasks and the Main Thread
The browser's main thread is single-threaded. Every JavaScript execution, style calculation, layout, and paint operation shares one queue. A task that runs for more than 50 ms is a "long task" and will delay any input events that occur during it.
Identifying Long Tasks
// Monitor long tasks in production
const observer = new PerformanceObserver((list) => {
  list.getEntries().forEach(entry => {
    if (entry.duration > 50) {
      console.warn('Long Task:', {
        duration: entry.duration,
        startTime: entry.startTime,
        attribution: entry.attribution,
      });
    }
  });
});
observer.observe({ type: 'longtask', buffered: true });
Task Chunking with scheduler.yield()
The most effective pattern for eliminating long tasks is to break synchronous work into chunks and yield the main thread between chunks. Chrome 115+ ships scheduler.yield() natively, which yields to higher-priority tasks (including user input) before resuming:
// Process a large array without blocking input
async function processItems(items) {
  const CHUNK_SIZE = 50;

  for (let i = 0; i < items.length; i += CHUNK_SIZE) {
    const chunk = items.slice(i, i + CHUNK_SIZE);
    processChunk(chunk);

    // Yield to browser — allows pending input events to fire
    if ('scheduler' in window && 'yield' in scheduler) {
      await scheduler.yield();
    } else {
      await new Promise(resolve => setTimeout(resolve, 0));
    }
  }
}
isInputPending for Conditional Yielding
// Only yield if user input is waiting — reduces unnecessary context switches
async function processWithInputCheck(items) {
  for (const item of items) {
    process(item);

    if (navigator.scheduling?.isInputPending()) {
      await scheduler.yield();
    }
  }
}
INP in React and Angular Applications
React 18's concurrent rendering significantly improved INP potential by making rendering interruptible. However, many React applications still have INP problems because they use useState updates that trigger full synchronous re-renders before yielding back to the browser.
React: Deferring Non-Urgent Updates
import { useState, useDeferredValue, useTransition } from 'react';

function SearchResults() {
  const [query, setQuery] = useState('');
  const [isPending, startTransition] = useTransition();

  // Deferred value — React can interrupt rendering of results
  // to handle more urgent updates (like more keystrokes)
  const deferredQuery = useDeferredValue(query);

  const handleChange = (e) => {
    // Urgent: update the input immediately
    setQuery(e.target.value);

    // Non-urgent: wrap heavy state updates in startTransition
    startTransition(() => {
      // This update can be interrupted if user types again
      updateFilters(e.target.value);
    });
  };

  return (
    <>
      <input value={query} onChange={handleChange} />
      {isPending && <Spinner />}
      <Results query={deferredQuery} />
    </>
  );
}
Angular: OnPush + Signals
In Angular 17+, Signals provide fine-grained reactivity that avoids full component tree re-checks. Combined with ChangeDetectionStrategy.OnPush, this dramatically reduces the processing duration phase of INP for click interactions that update UI state:
// Angular 17+ Signals — fine-grained reactivity for INP
import { Component, signal, computed, ChangeDetectionStrategy } from '@angular/core';

@Component({
  selector: 'app-product-list',
  changeDetection: ChangeDetectionStrategy.OnPush,
  template: `
    <button (click)="toggleFilter()">Filter</button>
    <div *ngFor="let p of visibleProducts()">{{ p.name }}</div>
  `
})
export class ProductListComponent {
  allProducts = signal<Product[]>([]);
  filterActive = signal(false);

  // Computed signal — only recalculates when dependencies change
  visibleProducts = computed(() =>
    this.filterActive()
      ? this.allProducts().filter(p => p.inStock)
      : this.allProducts()
  );

  toggleFilter() {
    this.filterActive.update(v => !v);
    // Angular only re-renders components that use filterActive or visibleProducts
  }
}
Third-Party Scripts and INP
Third-party scripts are among the most common causes of INP failure in field data that doesn't reproduce in lab testing. Scripts from analytics platforms, A/B testing tools, chat widgets, and ad networks run on the shared main thread and generate long tasks that create input delay for user interactions.
Auditing Third-Party Impact
In Chrome DevTools Performance panel, record a typical session. In the Main thread flame chart, look for tasks originating from external domains. Third-party scripts often use setInterval at 100–500 ms intervals to poll for state changes — these create regular long tasks that statistically increase the chance of input delay on any given interaction.
Sandboxing with Workers
// Move non-DOM third-party work off the main thread with a worker
// worker.js
self.addEventListener('message', ({ data }) => {
  if (data.type === 'TRACK_EVENT') {
    // Run analytics processing in worker
    fetch('/collect', {
      method: 'POST',
      body: JSON.stringify(data.payload),
      keepalive: true,
    });
  }
});

// main.js
const analyticsWorker = new Worker('/worker.js');

function trackEvent(eventName, props) {
  // Off main thread — zero input delay impact
  analyticsWorker.postMessage({
    type: 'TRACK_EVENT',
    payload: { event: eventName, ...props }
  });
}
Loading Scripts with Lowest Priority
<!-- Load non-critical scripts with low fetchpriority -->
<script src="https://third-party-analytics.com/tracker.js"
        async
        fetchpriority="low"></script>

<!-- Or defer entirely until after LCP + user-idle -->
<script>
window.addEventListener('load', () => {
  requestIdleCallback(() => {
    const s = document.createElement('script');
    s.src = 'https://chat-widget.com/widget.js';
    document.head.appendChild(s);
  }, { timeout: 5000 });
});
</script>
Optimization Patterns with Code
Debounce vs Immediate Response
A common mistake: debouncing the event handler itself. Users expect immediate visual feedback. The correct pattern is to update UI state immediately (so the browser can paint), then debounce the expensive secondary work:
// Wrong: debouncing the handler delays visual response
searchInput.addEventListener('input', debounce(handleSearch, 300));

// Correct: immediate visual update, debounced expensive work
searchInput.addEventListener('input', (e) => {
  // Immediate: show loading state (fast, synchronous)
  setLoadingState(true);

  // Debounced: the expensive API call
  debouncedFetch(e.target.value);
});
requestAnimationFrame for Visual Updates
// Schedule visual updates in rAF to batch with browser paint cycle
element.addEventListener('click', (e) => {
  e.preventDefault();

  // Don't modify DOM synchronously in the handler
  // — it can cause layout thrashing

  requestAnimationFrame(() => {
    // This runs just before paint — batched and efficient
    expandAccordion(e.target.closest('.accordion'));
  });
});
DevTools Workflow for INP Investigation
- Open Chrome DevTools → Performance panel. Enable "Web Vitals" lane in settings.
- Click "Record", perform the suspect interaction (the one users complain about or your RUM shows as slow), then stop recording.
- In the recording, find the "Interactions" lane. Slow interactions appear as long red bars.
- Click the interaction bar. The summary panel shows total INP duration and which phase (input delay / processing / presentation) is dominant.
- In the Main thread flame chart below the Interactions lane, find the tasks that overlap with the interaction. The longest tasks consuming the processing phase are your targets.
- Click into tasks to see the call stack. Identify which function is at the top of the stack consuming the most time.
See our JavaScript optimization guide for systematic strategies once you've identified the slow function.
FAQ
What is the INP threshold for "Good" in 2026?
INP ≤ 200 ms is Good. 200–500 ms is Needs Improvement. Above 500 ms is Poor. These thresholds have been stable since INP's promotion to Core Web Vital in March 2024 and are not expected to change in 2026. The thresholds were chosen based on research showing users perceive responses under 200 ms as immediate.
Does INP apply to scroll events?
No. Scroll events are explicitly excluded from INP measurement. INP only measures discrete interactions: clicks, taps, and keyboard inputs. Scroll jank is measured separately through the "Smooth animation" heuristics that are not yet a Core Web Vital. However, scroll-triggered JavaScript (IntersectionObserver callbacks, scroll event listeners running heavy computation) can create long tasks that delay subsequent click interactions.
How does INP handle interactions on pages with iframes?
Interactions with content inside a cross-origin iframe are not attributed to the parent page's INP. Each frame has its own Event Timing entries. However, a script in the iframe that posts a message to the parent, triggering a heavy parent-page handler, will show up in the parent's INP measurement because the handler runs in the parent's main thread.
Can server response time affect INP?
Indirectly, yes. If a click handler makes a fetch() call and then updates the DOM only after the response arrives, the INP for that interaction is measured up to the next paint after the DOM update — which includes the server response time. Use optimistic UI updates: update the DOM immediately based on expected outcome, then reconcile if the server response differs. This moves the paint to immediately after the click, not after the API response.
My INP is Poor in CrUX but I can't reproduce it in DevTools. Why?
Several reasons: your test device is faster than the p75 real user device (use 4× CPU throttle in DevTools); you're not logged in (authentication triggers additional script loading); you're not running the same third-party scripts as production; or the slow interaction only occurs under specific user flows you haven't tested. Use RUM with web-vitals.js attribution and the LoAF script data to identify the exact interaction, element, and script causing the field regression. The Chrome Speed Metrics team's INP debugging guide covers field-to-lab transfer in detail.
Does React Server Components help INP?
Yes, significantly. RSC moves component rendering to the server, sending minimal JavaScript to the client. Less client JavaScript means fewer long tasks during load and during interactions. Critically, RSC reduces hydration cost — hydration is a common source of Poor INP on initial page load because it creates a burst of main thread work that delays early interactions. See our JavaScript rendering guide for RSC and INP specifics.
Key Takeaways
- INP replaced FID in March 2024. It measures all interactions, end-to-end (input delay + processing + presentation), and reports worst-case.
- INP Good ≤ 200 ms, Poor > 500 ms at p75 of field data.
- The three phases (input delay, processing, presentation) require different fixes: reduce long tasks for input delay, optimize handlers for processing, use rAF and avoid forced layout for presentation.
- Use
web-vitals.jsv4 withlongAnimationFrameEntriesin production RUM to attribute INP to specific scripts — including third-party ones. - React's
useTransitionanduseDeferredValueare the primary React-specific INP fixes. Angular Signals with OnPush serve the same purpose. scheduler.yield()is the correct way to break long tasks in Chrome 115+. Fall back tosetTimeout(0)for older browsers.- Third-party scripts running
setIntervalpolling are a silent INP killer in field data — audit with LoAF attribution and load non-critical scripts viarequestIdleCallback.
Conclusion
INP is a harder metric to optimize than FID because it exposes the full cost of your JavaScript architecture, not just the behavior at page load. The sites with genuinely Good INP in 2026 have invested in main thread discipline: they yield frequently, they defer non-critical work, they avoid synchronous DOM operations in event handlers, and they instrument field data to catch regressions before they affect CrUX scores. Start with RUM attribution, identify the worst interactions by element and script, and work through the phases systematically. The tooling in 2026 — LoAF entries, scheduler.yield(), React 18 concurrent features — makes this more tractable than it was when INP first launched.