Getting LCP below 2.5 seconds is the single most impactful Core Web Vitals optimization most sites can make — it directly affects the metric with the clearest correlation to both rankings and revenue. But "optimize LCP" is not one task; it is a diagnostic chain. The correct intervention depends entirely on which of the four LCP sub-parts is eating your budget. This article walks through every sub-part systematically, with real waterfall patterns, code, and configuration examples that apply to production environments in 2026.
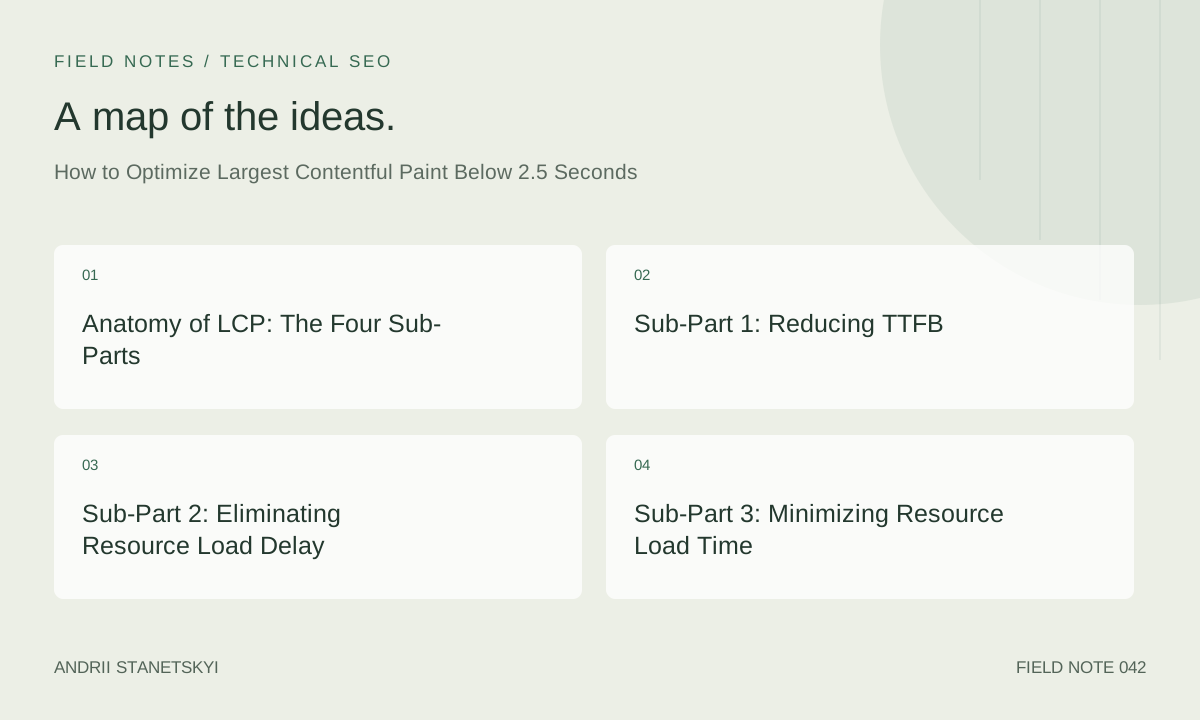
Anatomy of LCP: The Four Sub-Parts
The web-vitals library v3+ exposes a breakdown of LCP into four sequential time slices. Understanding which slice dominates your waterfall determines your entire optimization strategy. Trying to preload an image when your actual problem is a 1.2-second TTFB is theater — it shifts 100 ms and leaves the core problem untouched.
| Sub-Part | Definition | Target Budget | Primary Levers |
|---|---|---|---|
| TTFB | NavigationStart → first byte of HTML | ≤ 800 ms | CDN, caching, server optimization |
| Resource Load Delay | TTFB → browser starts fetching LCP resource | ≤ 200 ms | Preload, fetchpriority, parser unblocking |
| Resource Load Time | Fetch start → fetch end of LCP resource | ≤ 500 ms | Image compression, CDN edge, HTTP/2 |
| Element Render Delay | Fetch end → LCP element painted | ≤ 200 ms | Unblock main thread, remove paint-holding CSS |
The sum of all four is your LCP time. A 2.5 s target requires disciplined budgeting across all four — letting any single sub-part run to 1.5 s makes the target unreachable regardless of the others.
Sub-Part 1: Reducing TTFB
TTFB is controlled by server latency and network routing. For static or mostly-cached pages, the primary tool is CDN edge caching. For dynamic pages — personalized commerce, CMS-rendered pages with user state — the problem is harder and requires edge rendering, stale-while-revalidate, or fragment caching strategies.
CDN Cache Configuration
# Nginx: Set aggressive caching for HTML with stale-while-revalidate
location / {
    proxy_pass http://origin;
    proxy_cache_valid 200 10m;
    add_header Cache-Control "public, max-age=300, stale-while-revalidate=600";
    add_header Vary "Accept-Encoding, Accept";
}

# For static assets: long TTL
location ~* \.(js|css|avif|webp|woff2)$ {
    expires 1y;
    add_header Cache-Control "public, max-age=31536000, immutable";
}
Edge-Side Personalization
The most effective TTFB reduction for dynamic sites is moving personalization logic to the CDN edge using edge workers (Cloudflare Workers, Fastly Compute, CloudFront Functions). Cache the full HTML at the edge, then use an edge worker to inject a user-specific cookie value or replace a <!-- USER_DATA --> placeholder with a tiny JSON blob before delivery. The main HTML response serves from cache in < 50 ms; personalization cost is < 5 ms at the edge.
// Cloudflare Worker: serve cached HTML, inject user token
export default {
  async fetch(request, env) {
    const cache = caches.default;
    let response = await cache.match(request);

    if (!response) {
      response = await fetch(request);
      // Cache the canonical HTML
      await cache.put(request, response.clone());
    }

    // Edge personalization — inject user segment
    const userSegment = getUserSegment(request.headers.get('Cookie'));
    const html = await response.text();
    const personalized = html.replace(
      '',
      <script>window.__seg="${userSegment}"</script>
    );

    return new Response(personalized, {
      headers: { ...Object.fromEntries(response.headers), 'X-Edge-Cache': 'HIT' }
    });
  }
};
Sub-Part 2: Eliminating Resource Load Delay
Resource load delay is the time between TTFB and when the browser begins fetching the LCP resource. This is overwhelmingly the most common LCP failure mode. A browser that receives the HTML but doesn't start downloading the hero image until 800 ms later has wasted 800 ms entirely — the image was always going to need that network time, and you gave it to nothing.
Why Discovery Delay Happens
The browser's preload scanner reads raw HTML bytes to queue high-priority fetches before the main parser reaches those elements. The preload scanner is fast but limited: it cannot discover resources referenced in CSS (background-image), JS-injected images, or images loaded via IntersectionObserver. These resources are effectively invisible until the main parser or JS execution reveals them — which can be 500–1500 ms into page load.
The Fix: Preload + fetchpriority
<!-- In <head>, before any blocking stylesheets -->
<link rel="preload"
      as="image"
      href="/hero.avif"
      imagesrcset="/hero-400.avif 400w,
                   /hero-800.avif 800w,
                   /hero-1600.avif 1600w"
      imagesizes="(max-width: 768px) 100vw, 1280px"
      fetchpriority="high">

<img src="/hero.avif"
     srcset="/hero-400.avif 400w,
             /hero-800.avif 800w,
             /hero-1600.avif 1600w"
     sizes="(max-width: 768px) 100vw, 1280px"
     fetchpriority="high"
     decoding="async"
     width="1280"
     height="600"
     alt="Product hero">
Critical: the imagesrcset on the preload must exactly match the srcset on the <img>. A mismatch causes the browser to make two separate fetches — the preloaded resource doesn't get used. Verify with Chrome DevTools Network tab: the LCP image request should show "Highest" priority and zero queuing time.
Server-Side Preload Headers
For pages where the LCP image URL is dynamic (e.g., product images vary per SKU), inject the preload as an HTTP response header. This reaches the browser before the HTML body is parsed:
Link: </products/widget-hero.avif>;
      rel=preload; as=image; fetchpriority=high
H2 Push is deprecated and removed in Chrome. Use Link: rel=preload headers instead — they trigger browser-initiated fetches with no server-side push complexity.
Avoiding Double-Fetch Anti-Patterns
- Do not add
loading="lazy"to the LCP image — it suppresses early fetch. - Do not use CSS
background-imagefor the LCP element unless you add a preload header server-side. - Do not conditionally render the LCP image in JS after DOM ready — the browser sees it too late.
- If using a JS framework (Next.js, Nuxt), use the framework's
Imagecomponent's priority prop, which generates the preload tag at build time.
Sub-Part 3: Minimizing Resource Load Time
Once the browser starts fetching the LCP image, load time is determined by file size and network conditions. On a simulated Fast 3G (1.6 Mbps down), a 200 KB image takes ~1 second. On a real 4G connection at 10 Mbps, that's 160 ms. Optimizing for the p75 user means targeting real-world mid-range network conditions, not laboratory fast connections.
Format and Compression Targets
For LCP images in 2026: use AVIF as the primary format with WebP fallback. AVIF typically achieves 50–60% smaller file size than optimized JPEG at equivalent visual quality. Target 80–100 KB for a full-bleed hero image at 1280px width.
<picture>
  <source
    type="image/avif"
    srcset="/hero-400.avif 400w, /hero-800.avif 800w, /hero-1280.avif 1280w"
    sizes="(max-width: 768px) 100vw, 1280px">
  <source
    type="image/webp"
    srcset="/hero-400.webp 400w, /hero-800.webp 800w, /hero-1280.webp 1280w"
    sizes="(max-width: 768px) 100vw, 1280px">
  <img
    src="/hero-1280.jpg"
    width="1280"
    height="600"
    fetchpriority="high"
    alt="Hero">
</picture>
CDN Edge Proximity
Network round-trip time is irreducible physics. A CDN PoP in the user's city reduces image load time by 80–150 ms compared to a single-origin server in a remote data center. For image assets specifically, use a CDN with edge image transformation (Cloudflare Images, Fastly IO, Imgix) to serve correctly-sized AVIF without managing a variant pipeline manually.
Sub-Part 4: Cutting Element Render Delay
Element render delay is the gap between when the LCP image finishes downloading and when it actually paints on screen. This gap exists because the main thread is busy — running JavaScript, resolving style calculations, or executing long tasks — and cannot commit the frame.
Diagnosing Render Delay
In Chrome DevTools Performance panel, record a page load. Find the LargestContentfulPaint event marker. Look at what is running on the main thread in the milliseconds before that marker. Long tasks (red bars) immediately before LCP paint are the culprits.
Common sources:
- Synchronous scripts in
<body>after the LCP element that parse before the first paint - CSS
@font-facewithfont-display: blockholding paint until fonts load - Heavy
DOMContentLoadedhandlers running synchronously - React hydration on large component trees competing with the paint commit
Yielding to the Browser
// Break up work that runs before LCP to yield the main thread
async function initApp() {
  // Do critical init first
  await initAnalytics();

  // Yield before heavy work — lets browser paint LCP
  await scheduler.yield(); // Chrome 115+ native
  // Fallback: await new Promise(r => setTimeout(r, 0));

  // Now do non-critical heavy work
  await initThirdPartyWidgets();
  await loadPersonalization();
}
Image Optimization for LCP Elements
Responsive Images Without Oversizing
A common anti-pattern: serving a 1920px image to a 375px mobile viewport. The browser downloads 4× more data than it will display. Use srcset + sizes correctly to let the browser choose the right variant. Audit with Lighthouse's "Properly size images" diagnostic.
Decode Hint
Add decoding="async" to non-LCP images. For the LCP image itself, omit it or use decoding="sync" — you want synchronous decode so the image is ready to paint immediately when the main thread is available. In practice, Chrome handles LCP image decode priority internally, but being explicit avoids framework overrides.
Image CDN Pipeline
// Next.js Image component — correct LCP configuration
import Image from 'next/image';

export function HeroImage({ src, alt }) {
  return (
    <Image
      src={src}
      alt={alt}
      width={1280}
      height={600}
      priority={true}       // Generates preload + fetchpriority="high"
      quality={80}          // 80 = good AVIF quality
      sizes="(max-width: 768px) 100vw, 1280px"
    />
  );
}
Waterfall Case Study: E-Commerce PDP
A product detail page (PDP) on a mid-size e-commerce site had field LCP of 4.2 seconds (Poor) with a p75 measured from CrUX on mobile. Lab analysis in WebPageTest showed the following waterfall pattern:
- 0–820 ms: Server response (TTFB 820 ms — slow dynamic rendering, no CDN for HTML)
- 820–1,050 ms: HTML parsed, render-blocking stylesheet requested
- 1,050–1,650 ms: Stylesheet loaded
- 1,650 ms: Product image fetch begins (discovered via CSS background-image)
- 1,650–2,900 ms: Product image loads (320 KB JPEG, no CDN for images)
- 2,900–4,200 ms: Main thread blocked by analytics + chat widget initialization
- 4,200 ms: LCP paint
The interventions applied:
- HTML served from Cloudflare cache (TTFB dropped from 820 ms to 65 ms)
- Product image moved from CSS background to
<img>with preload header injected by Cloudflare Worker based on product ID in URL - Image re-encoded as AVIF via Cloudflare Images (320 KB → 68 KB)
- Analytics deferred past
scheduler.yield()call, chat widget lazy-loaded after LCP
Before / After Metrics
| Metric | Before | After | Change |
|---|---|---|---|
| LCP (CrUX p75 Mobile) | 4.2 s (Poor) | 2.1 s (Good) | -50% |
| TTFB (lab) | 820 ms | 65 ms | -92% |
| LCP Resource Load Delay | 830 ms | 0 ms | -100% |
| LCP Image File Size | 320 KB JPEG | 68 KB AVIF | -79% |
| LCP Element Render Delay | 1,300 ms | 140 ms | -89% |
| CWV Pass Rate (Mobile) | 34% | 81% | +47pp |
See our full CDN configuration guide for the exact Cloudflare Worker and Cache Rule setup used in this case study.
FAQ
Does preloading the LCP image always improve LCP?
Not always. If the LCP image is already in the HTML as an <img> tag near the top of the document, the preload scanner already queues it at high priority. Adding a duplicate preload can cause double-fetch warnings. Audit with Chrome DevTools Network panel: if the image already shows "Highest" priority with zero queuing delay, a preload tag adds nothing. Preloading is critical when the image is in CSS background, lazy-loaded, or dynamically inserted.
Should I inline the LCP image as a base64 data URI?
Almost never. Inlining moves the image bytes into the HTML, which must download completely before the browser can parse anything. A 100 KB image inlined as base64 becomes ~133 KB of HTML that blocks all subsequent parsing. The only case where inlining is justified is extremely small critical images (logos < 2 KB) where the HTTP round-trip cost exceeds the payload cost.
My LCP element is a text block, not an image. How does optimization differ?
For text-based LCP, the dominant causes are: render-blocking stylesheets preventing paint, web fonts with font-display: block, and server-side render latency. Fix: use font-display: optional for fonts used in the LCP text block, serve fonts from the same origin (eliminates cross-origin DNS + TLS overhead), and eliminate render-blocking CSS in the critical path.
How do I identify the LCP element programmatically in production?
// Log LCP element for debugging
const observer = new PerformanceObserver((list) => {
  const entries = list.getEntries();
  const last = entries[entries.length - 1];
  console.log('LCP element:', last.element, 'URL:', last.url, 'Size:', last.size);
});
observer.observe({ type: 'largest-contentful-paint', buffered: true });
Is fetchpriority="high" different from rel="preload"?
Yes. rel="preload" tells the browser to fetch the resource early, before the parser reaches it. fetchpriority="high" tells the browser to prioritize this fetch over others at the same discovery time. They solve different problems and are most effective in combination: preload for early discovery, fetchpriority for queue priority. Without preload, fetchpriority on the <img> tag still helps — it promotes the image above other resources queued at the same time.
How does LCP measurement differ between single-page apps and traditional pages?
In SPAs, LCP is measured per navigation using the Navigation Timing API for soft navigations. Chrome 117+ supports soft navigation heuristics that re-measure LCP, CLS, and INP for each route change. Web-vitals.js v4 includes experimental soft navigation support. Without it, SPA route changes after the initial load don't generate new LCP entries — the initial LCP candidate is locked after first interaction.
What Lighthouse audit score corresponds to LCP under 2.5 seconds?
Lighthouse scores LCP on a log-normal curve. LCP of 2.5 s corresponds to approximately a Lighthouse performance score contribution of 70–75 out of 100 for that metric. The Lighthouse overall performance score weights LCP at 25%. A 2.5 s LCP on a page with otherwise good metrics typically results in an overall score in the 85–92 range, depending on other weighted metrics (TBT, FCP, Speed Index).
Key Takeaways
- Diagnose which of the four LCP sub-parts (TTFB, load delay, load time, render delay) dominates before intervening.
- Resource load delay is the most common cause of Poor LCP; fix it with
<link rel="preload">+fetchpriority="high"on the LCP<img>. - TTFB above 800 ms makes 2.5 s LCP nearly impossible — CDN HTML caching is the highest-leverage server-side fix.
- AVIF at 80 quality reduces LCP image payload by 50–70% vs JPEG with equivalent visual quality.
- Element render delay above 200 ms means main thread congestion — yield with
scheduler.yield()orsetTimeout(0)before non-critical initialization. - Match
imagesrcseton<link rel="preload">exactly to thesrcseton the<img>to avoid double-fetch. - Never add
loading="lazy"to the LCP image — it delays discovery and defeats preload.
Conclusion
LCP optimization is a methodical process, not a list of best practices to apply blindly. The four sub-parts give you a diagnostic framework that works on any technology stack. Start by instrumenting web-vitals.js with attribution in production so you know which sub-part your real p75 users are hitting. Then target interventions precisely. Combine this with INP optimization and you have the two biggest CWV levers working in parallel — most sites can achieve Good on both within 6–8 weeks of focused engineering effort.