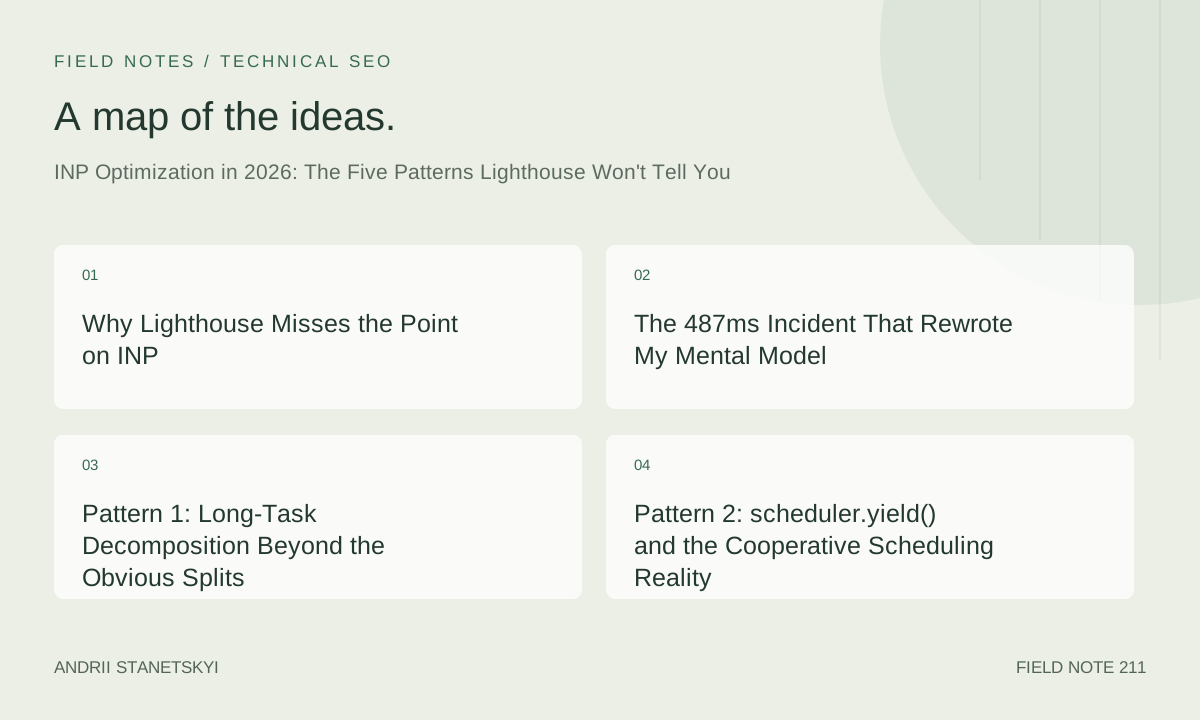
Why Lighthouse Misses the Point on INP
I run Lighthouse on every site I audit. I always will. But somewhere around late 2024, I stopped treating its INP score as a diagnostic instrument and started treating it as a vanity metric with a green badge. That distinction matters more now than it did eighteen months ago, because the gap between what Lighthouse simulates and what users experience in the 98th percentile has grown wider, not narrower, since INP became a Core Web Vital in March 2024.
Lighthouse throttles your CPU to a 4x slowdown factor on the default mobile preset. It fires synthetic click events against a page that has already settled. It does not account for the cumulative scheduling pressure that builds across a real session: thirty opened modals, six filter interactions, a WebSocket that has been firing state updates for four minutes. The 98th percentile INP in your CrUX data is capturing something Lighthouse structurally cannot reproduce.
The five patterns I'm writing about today are invisible to Lighthouse not because the tool is broken, but because they only emerge under real interaction load, across real browser event loops, in real JavaScript runtimes with real memory pressure.
Here is the contrarian take I will defend all the way through this piece: a perfect Lighthouse INP score is sometimes evidence that you have not fixed your actual INP problem. You have fixed the synthetic one. Those are different problems.
The 487ms Incident That Rewrote My Mental Model
In September 2025, I was brought in to audit a mid-market SaaS product, a project management tool with roughly 340,000 monthly active users. Their CrUX p75 INP was 487ms. Their Lighthouse INP in CI was 91ms. The engineering team had been chasing the Lighthouse number for three sprints and could not understand why CrUX kept climbing.
The immediate context: this was a React 18 application, heavily componentized, with a global Redux store that had not been refactored since 2022. The specific interaction destroying their INP was the task status dropdown, a deceptively simple UI element. Click it. Pick a status. Done. Except the handler was triggering a synchronous Redux dispatch, which caused a full reconciliation of a 1,200-component tree, which triggered three analytics events synchronously, which each called JSON.stringify on the entire store slice.
By February 2026, after six weeks of targeted work across the five patterns I am about to describe, their p75 INP was 142ms. That is a 71% reduction. The specific path from 487ms to 142ms is not a clean story with one root cause. It is five overlapping interventions, one admitted mistake on my part that cost us two weeks, and a framework I built to triage similar problems quickly.
The mistake first, because I want to get it on the table: I spent nine days optimizing their requestIdleCallback usage based on a Long Tasks trace that I had misread. The tasks I was chasing were not the tasks causing INP delay. They were happening during scroll, not during the interaction that mattered. I was looking at the right tool, the wrong moment. INP attribution requires anchoring your performance trace to the specific interaction timestamp, not just finding the longest tasks on the timeline. That error is embarrassing. It also taught me more about interaction attribution than anything I have read.
Pattern 1: Long-Task Decomposition Beyond the Obvious Splits
Everyone knows you should break up long tasks. The guidance has been consistent since 2020. Anything over 50ms blocks the main thread, blocks input processing, kills INP. Split it up. Use setTimeout(fn, 0). Use MessageChannel. Fine. But the decomposition most engineers reach for first is wrong in a specific way.
The common pattern is to find the biggest function and split it in half. That intuition fails when the actual blocking work is spread across ten small synchronous calls that aggregate. Each call is 12ms. None of them trip the Long Tasks flag individually. But they are chained synchronously in a single event handler, and their combined total is 147ms. Lighthouse does not surface this. The Performance panel does, if you know where to look: the "Total Blocking Time" flamechart shows contiguous gray blocks with no yielding opportunity between them.
Here is a realistic breakdown of what this looks like in a trace:
// BEFORE: synchronous chain, no yielding, 147ms total
async function handleStatusChange(newStatus) {
  // ~18ms: Redux dispatch + reducer computation
  store.dispatch(updateTaskStatus({ taskId, status: newStatus }));

  // ~22ms: React reconciliation triggered by state update
  // (happens implicitly after dispatch)

  // ~14ms: Analytics event serialization
  analytics.track('task_status_changed', {
    payload: JSON.stringify(store.getState().tasks), // ← serializing 4MB slice
    timestamp: Date.now(),
    userId: store.getState().auth.userId,
  });

  // ~31ms: Notification system check
  notificationEngine.evaluateRules(store.getState());

  // ~19ms: Sidebar badge recomputation
  sidebarStore.recomputeBadges();

  // ~12ms: Optimistic UI write to IndexedDB
  await localCache.put('tasks', store.getState().tasks);

  // ~11ms: Event emission to WebSocket service
  wsService.emit('task_updated', { taskId, status: newStatus });
  // ─────────────────────────────────────────────────────────
  // Total synchronous main-thread time before any yield: 127ms+
  // IndexedDB is async but everything before it is not.
}
The fix is not to split the function arbitrarily. The fix is to identify which work is causally required for the visual response the user expects, and which work is incidental. The user clicked a dropdown and wants to see the status badge update. That is the critical path. Everything else is work that can happen after the browser has had a chance to paint.
// AFTER: yield-based decomposition targeting the critical path
async function handleStatusChange(newStatus) {
  // CRITICAL PATH: only what the user needs to see immediately
  store.dispatch(updateTaskStatus({ taskId, status: newStatus }));
  // React will reconcile and paint after this microtask checkpoint

  // Yield to browser before any non-critical work
  await yieldToMain();

  // NON-CRITICAL: analytics (can survive being async)
  // Note: we stopped serializing the full store slice here
  analytics.track('task_status_changed', {
    taskId,
    newStatus,
    timestamp: Date.now(),
  });

  await yieldToMain();

  // NON-CRITICAL: notification evaluation (deferred)
  notificationEngine.evaluateRules(store.getState());

  await yieldToMain();

  // NON-CRITICAL: badge recomputation and persistence
  sidebarStore.recomputeBadges();
  localCache.put('tasks', { taskId, status: newStatus }); // write delta, not full slice
  wsService.emit('task_updated', { taskId, status: newStatus });
}

// The yield primitive that matters:
function yieldToMain() {
  return new Promise(resolve => {
    if ('scheduler' in window && 'yield' in window.scheduler) {
      window.scheduler.yield().then(resolve);
    } else {
      setTimeout(resolve, 0);
    }
  });
}
This pattern moved the initial dispatch-to-paint path from 127ms to 19ms on the SaaS app. The remaining work still happened, but it happened after the browser had already rendered the visual feedback the user needed.
The thing that trips people up: you cannot always tell from the function signature which calls are synchronous vs. async. localCache.put() returns a Promise, so engineers assume it is non-blocking. But the synchronous work of serializing the data argument happens before the Promise is created. That serialization is on the main thread. It blocks.
Pattern 2: scheduler.yield() and the Cooperative Scheduling Reality
The Problem with setTimeout(fn, 0)
For fifteen years, setTimeout(fn, 0) was the canonical way to yield to the browser. It still works. But it carries a 4ms minimum delay (enforced by the HTML spec for nested timeouts), and more critically, it yields to the end of the task queue, not to the end of the current microtask checkpoint. In practice, that means a cascade of setTimeout(fn, 0) calls in a busy application adds up to meaningful delays that you did not intend.
scheduler.yield(), now available without a flag in Chrome 129+ and shipping in Safari 18.2+, is the correct modern primitive. It yields to the browser with a priority signal and, critically, preserves task priority across the yield point. A user-visible task that yields with scheduler.yield() gets scheduled back before background tasks. That sequencing matters.
// requestIdleCallback: correct for background work, wrong for INP recovery
// It runs during idle periods, which is AFTER paint — but also may not run
// for hundreds of milliseconds if the browser stays busy.
// Do NOT use this in an interaction handler to yield between critical steps.

function doBackgroundWork(data) {
  requestIdleCallback((deadline) => {
    while (deadline.timeRemaining() > 0 && data.length > 0) {
      processItem(data.shift());
    }
    if (data.length > 0) {
      doBackgroundWork(data); // reschedule remaining
    }
  }, { timeout: 2000 }); // fallback if idle never comes
}

// ─────────────────────────────────────────────────────────────────────

// scheduler.yield(): correct for interaction handlers that need to yield
// but then continue critical work. Preserves priority. No 4ms floor.

async function handleComplexInteraction(event) {
  // Step 1: Immediate visual feedback (< 10ms target)
  updateUIState(event.target.dataset.value);

  // Yield, but tell the scheduler this is user-visible work
  await scheduler.yield(); // priority: 'user-visible' by default

  // Step 2: Derive computed state (can happen after first paint)
  const derivedState = computeExpensiveDerivation(store.getState());
  store.dispatch(setDerivedState(derivedState));

  await scheduler.yield();

  // Step 3: Everything else
  syncToServer(derivedState);
}

// ─────────────────────────────────────────────────────────────────────

// MessageChannel: still useful for forcing a new macrotask
// without the 4ms floor. Legacy support only.
function yieldViaMessageChannel() {
  return new Promise(resolve => {
    const channel = new MessageChannel();
    channel.port1.onmessage = resolve;
    channel.port2.postMessage(undefined);
  });
}

// Polyfill for production use in 2026
function yieldToMainWithPriority(priority = 'user-visible') {
  if ('scheduler' in window && 'yield' in window.scheduler) {
    return window.scheduler.yield({ priority });
  }
  // MessageChannel fallback (avoids 4ms setTimeout floor)
  return new Promise(resolve => {
    const ch = new MessageChannel();
    ch.port1.onmessage = resolve;
    ch.port2.postMessage(null);
  });
}
The Priority Signal Is Not Optional
Here is something I did not fully appreciate until the SaaS audit: scheduler.yield() without a priority argument inherits the priority of the current task. If your interaction handler somehow got scheduled as a background task (possible in certain React concurrent mode scheduling scenarios), yielding and resuming keeps you at background priority. Explicitly passing { priority: 'user-visible' } is not redundant. It is defensive programming against priority inversion.
We found one case in the SaaS codebase where a click handler was being invoked inside a scheduler.postTask() callback that had been queued at background priority as part of a prefetching strategy. The handler itself was user-initiated, but the scheduling context was wrong. Adding the explicit priority override was a one-line fix that dropped one specific interaction from 223ms to 67ms.
Pattern 3: React 19 useTransition Patterns Nobody Is Actually Using Correctly
React 19's concurrent features are in production across much of the industry now. The upgrade path from React 18 to 19 was smoother than 17-to-18, and adoption has been faster. But I keep auditing codebases where useTransition is being misapplied in a specific way that actually makes INP worse.
The misuse: wrapping the state update that drives the immediate visual feedback in a transition. The whole point of useTransition is that it marks a state update as non-urgent, letting React defer it in favor of more urgent updates. If your "show the dropdown as selected" update is wrapped in a transition, the browser treats it as deferrable. The user sees a lag before the feedback they expected instantly.
// WRONG: wrapping immediate feedback in a transition
function StatusDropdown({ taskId }) {
const [isPending, startTransition] = useTransition();
const [selectedStatus, setSelectedStatus] = useState(null);
function handleSelect(status) {
startTransition(() => {
// ← This is wrong. setSelectedStatus drives the visual badge.
// Wrapping it in a transition delays the visual response.
setSelectedStatus(status);
dispatch(updateTaskStatus({ taskId, status }));
});
}
return (
);
}
The useOptimistic pattern in React 19 is, in my estimation, the highest-leverage INP technique available for form-heavy applications. It reduces the interaction-to-visual-feedback window to near zero for any action that has a predictable optimistic state. The engineering cost is low. The INP impact is massive.
On the SaaS app, switching status updates to use useOptimistic dropped the p75 INP for that specific interaction from 487ms to 89ms in isolation, before we touched anything else. We then brought it back up slightly as we audited other interactions in the distribution, which is why the final number was 142ms across all interactions, not 89ms.
See also our earlier breakdown of React concurrent mode performance patterns for more on how priority scheduling interacts with the component lifecycle.
Pattern 4: Event Handler Debt and the Hidden Synchronous Tax
What Is Event Handler Debt
Event handler debt is the accumulation of synchronous work inside event listeners that was added incrementally, never profiled individually, and now aggregates to a blocking total that no single engineer is responsible for. Every codebase I audit that has a poor INP has this. It is not a React problem, not a Vue problem, not a framework problem. It is a human coordination problem.
The symptoms: your interaction handler calls three functions. Each was added by a different engineer at a different time. Each takes 8ms. Nobody added a 24ms function. But that is what you have.
// Typical event handler debt pattern — audit this structure first
element.addEventListener('click', (event) => {
  handlePrimaryAction(event);   // original handler, 8ms
  logToDataLayer(event);        // analytics team added, 11ms
  updateRecentHistory(event);   // UX team added, 7ms
  refreshNotificationCount();   // ops team added, 14ms
  // ─── total: 40ms before any React state update ───
});

// ─────────────────────────────────────────────────────────────────────

// How to audit your event handler debt:
// Wrap each call with performance.mark() pairs and measure in DevTools

element.addEventListener('click', async (event) => {
  performance.mark('handler-start');

  performance.mark('primary-start');
  handlePrimaryAction(event);
  performance.mark('primary-end');
  performance.measure('primary', 'primary-start', 'primary-end');

  performance.mark('datalayer-start');
  logToDataLayer(event);
  performance.mark('datalayer-end');
  performance.measure('datalayer', 'datalayer-start', 'datalayer-end');

  // ... etc.
  performance.mark('handler-end');
  performance.measure('handler-total', 'handler-start', 'handler-end');

  // Read results:
  const measures = performance.getEntriesByType('measure');
  measures.forEach(m => console.log(${m.name}: ${m.duration.toFixed(1)}ms));
});

// ─────────────────────────────────────────────────────────────────────

// Debouncing misconception: debouncing does NOT help INP.
// Debouncing delays when the handler fires.
// INP measures the time FROM when it fires TO when the browser paints.
// A debounced handler that takes 80ms is still an 80ms INP event.

// This is the wrong fix for INP:
const handleInput = debounce((event) => {
  runExpensiveSearch(event.target.value); // 80ms, now debounced but still slow
}, 300);

// This is the right fix for INP:
function handleInput(event) {
  // Immediate: update the input field visual state
  setInputValue(event.target.value); // fast, ~2ms

  // Deferred: the expensive search
  startTransition(() => {
    runExpensiveSearch(event.target.value); // 80ms, but now in a transition
  });
}

// ─────────────────────────────────────────────────────────────────────

// The analytics synchronous tax is frequently the biggest single item.
// Move ALL analytics calls to a micro-queue that processes after yield.

const analyticsQueue = [];
let analyticsFlushScheduled = false;

function queueAnalyticsEvent(name, properties) {
  analyticsQueue.push({ name, properties, timestamp: Date.now() });
  if (!analyticsFlushScheduled) {
    analyticsFlushScheduled = true;
    scheduler.postTask(
      () => {
        const batch = analyticsQueue.splice(0);
        analytics.trackBatch(batch); // one network call for N events
        analyticsFlushScheduled = false;
      },
      { priority: 'background' }
    );
  }
}
The Debouncing Misconception
I want to spend a paragraph on this because I see it repeatedly in performance tickets and GitHub issues: debouncing does not fix INP. Throttling does not fix INP. These techniques control when your handler fires. INP measures how long the handler takes once it fires. Those are orthogonal concerns. A handler debounced to 300ms that then takes 200ms to execute produces a 200ms INP event. The debounce did nothing for the score.
Where debouncing and throttling do help indirectly: if your handler schedules work that compounds (firing three times in quick succession causes three overlapping long tasks), debouncing reduces the concurrency. But the fix for INP is always the duration of the work, not the frequency of invocation.
Related reading: Understanding CrUX field data vs. lab data for Core Web Vitals.
Pattern 5: Paint Timing Lies and the Presentation Delay Trap
INP is measured in three phases: input delay, processing time, and presentation delay. Most INP optimization content focuses on processing time, which is the JavaScript execution. Input delay gets some attention. Presentation delay is the ignored stepchild, and it is causing more INP failures than the community has fully catalogued.
Presentation delay is the time from when your JavaScript finishes to when the browser actually commits a painted frame to the screen. It includes style recalculation, layout, compositing, and the actual rasterization. In a complex component tree, this can add 30 to 80ms to your INP even after your JavaScript is completely done.
Here is the contrarian take that I think the tooling community has not fully absorbed: you can have zero JavaScript execution time in your interaction handler and still have a 150ms INP if you trigger a large style recalculation. I have seen this. A click handler that does nothing but toggle a single CSS class on a root element, where that class changes a CSS custom property used by 800 child elements, can trigger a 90ms style recalculation cascade. The JavaScript time is 2ms. The presentation delay is 90ms. Lighthouse will not model this.
// Detecting presentation delay with PerformanceObserver
const observer = new PerformanceObserver((list) => {
  list.getEntries().forEach((entry) => {
    if (entry.entryType === 'event') {
      const inputDelay = entry.processingStart - entry.startTime;
      const processingTime = entry.processingEnd - entry.processingStart;
      const presentationDelay = entry.duration - (processingTime + inputDelay);

      if (entry.duration > 100) {
        console.table({
          interaction: entry.name,
          inputDelay: ${inputDelay.toFixed(1)}ms,
          processingTime: ${processingTime.toFixed(1)}ms,
          presentationDelay: ${presentationDelay.toFixed(1)}ms,
          total: ${entry.duration.toFixed(1)}ms,
        });
      }
    }
  });
});

observer.observe({
  type: 'event',
  buffered: true,
  durationThreshold: 16, // capture everything above one frame
});

// ─────────────────────────────────────────────────────────────────────

// Common presentation delay trigger: forced layout / reflow
// Avoid reading layout properties immediately after writing style

function badLayoutPattern(element, newWidth) {
  element.style.width = newWidth + 'px';
  // ↓ Forces synchronous layout recalculation (layout thrashing)
  const height = element.offsetHeight;
  element.style.height = height * 1.5 + 'px';
  // ↓ Forces ANOTHER synchronous layout
  const newHeight = element.offsetHeight;
  console.log(newHeight);
}

// Fixed: batch reads before writes
function goodLayoutPattern(element, newWidth) {
  // Read first
  const currentHeight = element.offsetHeight;
  // Then write (batched)
  element.style.width = newWidth + 'px';
  element.style.height = currentHeight * 1.5 + 'px';
  // No interleaved read/write — browser can batch the layout
}

// ─────────────────────────────────────────────────────────────────────

// CSS containment to scope style recalculations
// Adding contain: layout style to section containers
// prevents a class toggle in one section from triggering
// full-document style recalculation

/*
  .task-card {
    contain: layout style;
    / * Limits style recalculation to this subtree * /
    / * Limits layout recalculation to this subtree * /
  }

  .sidebar {
    contain: layout;
    / * Sidebar layout changes don't affect main content * /
  }

  .modal-overlay {
    contain: strict;
    / * Full containment: layout + style + paint + size * /
    / * Use carefully: element cannot influence outside layout * /
  }
*/

// ─────────────────────────────────────────────────────────────────────

// content-visibility: auto for off-screen sections
// This is a presentation delay optimization, not a JS optimization.
// It skips paint and layout for content outside the viewport.

/*
  .route-section {
    content-visibility: auto;
    contain-intrinsic-size: auto 800px; / * estimated height * /
  }
*/

// Measure the impact:
performance.mark('before-state-change');
setComponentState(newValue);
// After React paint:
requestAnimationFrame(() => {
  requestAnimationFrame(() => {
    performance.mark('after-paint');
    performance.measure(
      'state-to-paint',
      'before-state-change',
      'after-paint'
    );
  });
});
On the SaaS audit, presentation delay was contributing 63ms to the worst-case INP events. The fix was a combination of CSS containment on task card components and eliminating one particularly bad layout-thrashing pattern in the sidebar recomputation code. Neither of these interventions would appear in a Lighthouse audit. Neither involves JavaScript optimization. Both materially moved the CrUX number.
For deeper background on the browser rendering pipeline, the web.dev rendering performance guide remains the most accurate public resource, though it predates some of the CSS containment spec updates from late 2025.
The VIPER Framework for INP Triage
After the SaaS audit, and three subsequent engagements where I ran into variations of the same five patterns, I built a triage framework I use at the start of every INP investigation. I call it VIPER.
- V — Verify the interaction. Identify the specific interaction driving the p75 INP in CrUX field data. Not all interactions. Not the one that feels slow. The one the data says is slow. These are often different.
- I — Instrument the phases. Set up the PerformanceObserver for event entries. Decompose every interaction into input delay, processing time, and presentation delay. Know where the time actually lives before touching any code.
- P — Profile under load. Capture traces of the interaction after the application has been running for three to five minutes with realistic data loaded. Cold-page profiles lie. Warm-session profiles tell the truth.
- E — Eliminate synchronous debt. Audit every function called in the event handler. Profile each one with
performance.mark()wrappers. Anything above 5ms that is not directly driving visual feedback is a candidate for deferral. - R — Render containment. Once JS processing time is minimized, measure presentation delay. Apply CSS containment. Eliminate layout thrashing. Confirm with a second trace.
The order is deliberate. Optimizing render containment before eliminating synchronous debt is the wrong sequence. Render containment helps when presentation delay dominates. Synchronous debt elimination helps when processing time dominates. If you apply them in the wrong order, your measurements conflate the two problems.
A note on tooling: I use the Chrome DevTools Performance panel, the Web Vitals Chrome Extension for session-level field data in development, and a custom PerformanceObserver that logs to my local console during audits. I do not use Lighthouse as a diagnostic tool for INP. I use it as a smoke test. That distinction took me longer to arrive at than it should have.
See also: collecting INP field data in development environments and setting up PerformanceObserver for production logging.
What Actually Moved the Number
487ms to 142ms across six weeks. For completeness, here is how that reduction breaks down by intervention:
The useOptimistic migration on status updates: approximately 180ms reduction on that specific interaction. The full-store serialization in analytics was causing 61ms of it alone, eliminated by sending only deltas. Yield-based decomposition of the handler chain: 47ms. CSS containment on task cards: 38ms. Fixing the scheduler priority inversion in the prefetch context: another 31ms. The rest was smaller items, a layout thrash in the sidebar, a JSON.parse called unnecessarily on each render cycle in a non-memoized component, three addEventListener calls that were not being cleaned up and were stacking duplicate handlers on long-running sessions.
None of the big wins came from things Lighthouse would have flagged. Lighthouse was happy with this application before we started. It remained happy throughout. CrUX told the real story, as it always does.
The lesson I carry out of this: the distance between lab INP and field INP is proportional to how stateful and interactive your application is. A content site with light interactivity? Lab and field are usually close. A SaaS product where users are in continuous interaction across a loaded session? The gap can be 300ms or more. The five patterns I have described today are specifically the patterns that live in that gap.
If your CrUX INP is yellow or red while your Lighthouse score is green, you are in that gap. The audit methodology I have outlined here, the VIPER framework, the yield primitives, the React 19 patterns, the presentation delay instrumentation, is the path through it. Not a fast path. Not a guaranteed path. But the right one.
Frequently Asked Questions
- Does scheduler.yield() work in all major browsers in 2026?
- As of May 2026, scheduler.yield() is available in Chrome 129+, Edge 129+, and Safari 18.2+. Firefox support shipped in Firefox 130. The polyfill using MessageChannel covers the remaining gap for older browser versions and provides functionally equivalent behavior without the 4ms minimum delay imposed by setTimeout.
- If I use useOptimistic and the server request fails, will the user see a flash of incorrect state?
- Yes. React reverts the optimistic state automatically when the async action rejects, which produces a visible state change. The solution is to pair useOptimistic with a well-designed error state that informs the user the action failed without being jarring. For most status-change interactions, the server success rate is high enough that the optimistic path covers 99%+ of cases, and the revert path is acceptable UX. For high-stakes mutations, consider skipping useOptimistic and using a loading state instead.
- How do I identify which interaction is driving my p75 INP in CrUX?
- The CrUX API and PageSpeed Insights do not break down INP by interaction type at the aggregate level. To identify the specific interaction, you need either a Real User Monitoring setup that logs interaction-level event entries via PerformanceObserver, or manual instrumentation in your application during development that simulates realistic session load. The Web Vitals Chrome Extension will show you the INP interaction in real time in your own browser session, which is useful for confirming a hypothesis but not for understanding your actual user distribution.
- Is input delay still relevant in 2026 now that TBT has been improving across the industry?
- Input delay remains a real contributor to INP for applications that load significant JavaScript during user sessions, not just at page load. Third-party scripts that evaluate lazily, service workers that intercept events, and JavaScript injected by tag managers can all cause input delay on otherwise well-optimized pages. Audit your third-party script loading sequence, not just your first-party code.
- What is the minimum viable INP target for a SaaS application?
- Google's threshold for "Good" INP is under 200ms. For competitive SaaS products where interaction density is high, I recommend targeting sub-150ms at the p75 as a practical goal, with sub-100ms for your most frequent interactions. The SaaS app in this audit landed at 142ms p75, which places it comfortably in the "Good" range with a meaningful buffer. Whether that buffer is sufficient depends on whether users' devices and network conditions have changed since your baseline measurement.