Log file analysis is the closest thing technical SEO has to a ground truth. Every other data source — GSC, third-party crawlers, analytics — is either sampled, filtered, or reports on proxies for what's actually happening. Your server access logs contain every request Googlebot made, what it received, and how long it waited. If you're not analyzing logs regularly, you're navigating with an incomplete map.
I've found crawl issues in log files that were invisible in every other tool: Googlebot spending 60% of its crawl budget on URLs that had been 301-redirecting for two years, Googlebot-Smartphone and Googlebot-Desktop diverging in what they crawled (revealing a mobile rendering issue), and sudden drops in crawl rate that preceded ranking drops by three weeks.
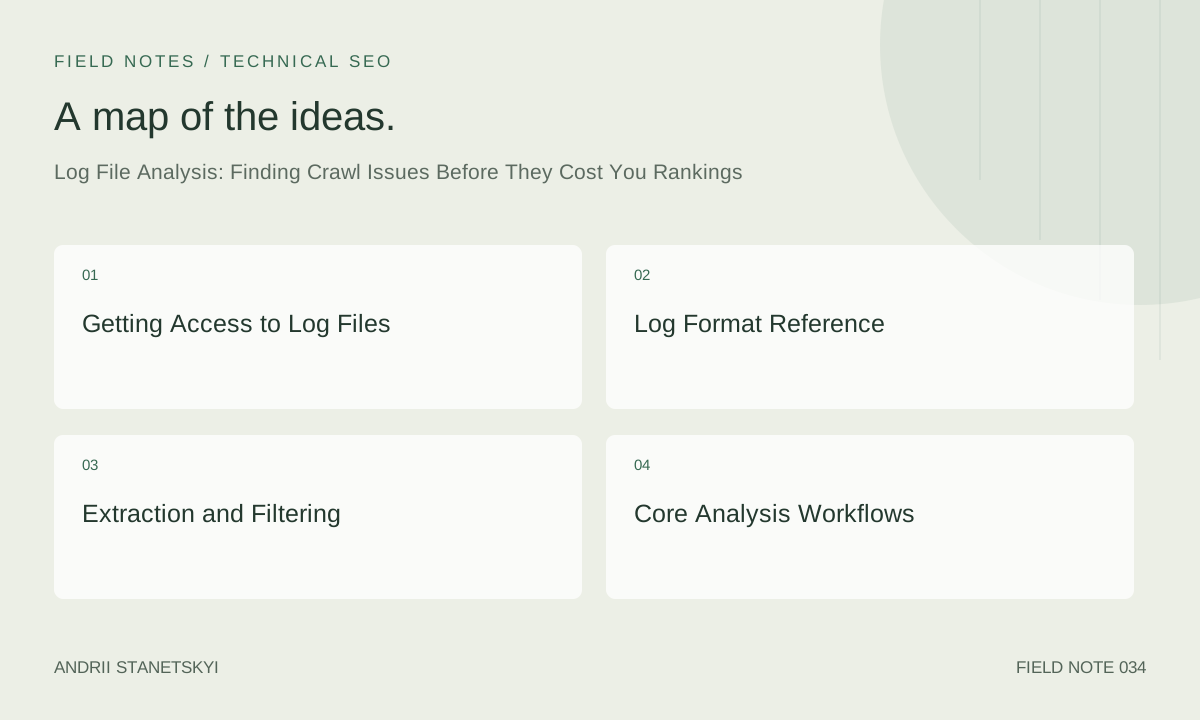
Getting Access to Log Files
This sounds trivial. It isn't. On enterprise sites, log access often involves IT security policies, data retention constraints, and multi-team approvals. Get this set up before you need it in a crisis. The most common blockers:
- Log location: Ask DevOps/SRE for the exact path. Common:
/var/log/nginx/access.log,/var/log/apache2/access.log,/var/log/httpd/access_log. - Rotation: Logs are typically rotated daily and compressed. You may need historical files (
access.log.2026-04-28.gz). Get 30–90 days minimum. - CDN logs: If Cloudflare, Fastly, or Akamai sits in front of your servers, your origin logs may not see all requests. Pull logs from the CDN layer, which captures the full Googlebot request before cache.
- Load balancer logs: On multi-server setups, each node has its own log. You need all of them aggregated.
Cloudflare's Logpush can export to S3, R2, or a SIEM. Fastly has similar functionality. Set this up to feed into ELK or BigQuery for ongoing analysis.
Log Format Reference
Nginx Combined Log Format
# Default nginx combined log format:
# $remote_addr - $remote_user [$time_local] "$request" $status $body_bytes_sent "$http_referer" "$http_user_agent"

# Example log lines:
66.249.75.30 - - [29/Apr/2026:08:42:17 +0000] "GET /products/running-shoe-red HTTP/1.1" 200 45231 "-" "Mozilla/5.0 (Linux; Android 6.0.1; Nexus 5X Build/MMB29P) AppleWebKit/537.36 (KHTML, like Gecko) Chrome/W.X.Y.Z Mobile Safari/537.36 (compatible; Googlebot/2.1; +http://www.google.com/bot.html)"

66.249.75.42 - - [29/Apr/2026:08:42:19 +0000] "GET /products/running-shoe-red?color=blue&utm_source=email HTTP/1.1" 200 45231 "-" "Mozilla/5.0 (Linux; Android 6.0.1; Nexus 5X Build/MMB29P) (compatible; Googlebot/2.1; +http://www.google.com/bot.html)"

66.249.66.1 - - [29/Apr/2026:08:43:02 +0000] "GET /old-page-redirected HTTP/1.1" 301 0 "-" "Mozilla/5.0 (compatible; Googlebot/2.1; +http://www.google.com/bot.html)"
Extended Format with Response Time
Add $request_time to your Nginx log format — it's critical for crawl performance analysis. Add to nginx.conf:
log_format extended '$remote_addr - $remote_user [$time_local] '
                    '"$request" $status $body_bytes_sent '
                    '"$http_referer" "$http_user_agent" '
                    '$request_time $upstream_response_time';

access_log /var/log/nginx/access.log extended;
Googlebot IP Ranges
Google publishes its IP ranges at https://developers.google.com/search/apis/ipranges/googlebot.json. For strict filtering, verify user-agent AND IP. User-agents can be spoofed; IP ranges cannot be faked in logs. Fetch and cache the range list:
curl -s https://developers.google.com/search/apis/ipranges/googlebot.json \
  | python3 -c "
import json, sys
data = json.load(sys.stdin)
for prefix in data['prefixes']:
    if 'ipv4Prefix' in prefix:
        print(prefix['ipv4Prefix'])
" > googlebot-ipv4.txt
Extraction and Filtering
Basic Googlebot Extraction
# Extract Googlebot requests (user-agent match)
grep -i "googlebot" /var/log/nginx/access.log > googlebot.log

# More precise: match Googlebot but exclude other Google bots (AdsBot, etc.)
grep -i "googlebot/2.1" /var/log/nginx/access.log > googlebot-main.log

# Separate smartphone from desktop
grep "Googlebot" /var/log/nginx/access.log | grep "Mobile" > googlebot-mobile.log
grep "Googlebot" /var/log/nginx/access.log | grep -v "Mobile" > googlebot-desktop.log

# Compressed historical logs
zcat /var/log/nginx/access.log.*.gz | grep -i "googlebot" > googlebot-30days.log
Date Range Filtering
# Extract specific date range (April 2026)
awk '/\[([0-9]{2}\/Apr\/2026)/' /var/log/nginx/access.log | grep "Googlebot" > googlebot-april.log

# Using awk for more precise date control
awk -v start="[01/Apr/2026" -v end="[29/Apr/2026" \
  '$4 >= start && $4 <= end && /Googlebot/' \
  /var/log/nginx/access.log > googlebot-range.log
Core Analysis Workflows
1. Response Code Distribution
# Response code breakdown for Googlebot
awk '{print $9}' googlebot.log | sort | uniq -c | sort -rn

# Expected healthy output:
# 15420 200
#   342 301
#    89 302
#    45 404
#     8 500

# Concerning output (too many redirects/errors):
#  8200 200
#  4100 301   <-- 33% redirect waste
#  1800 404   <-- crawl budget wasted on errors
#   300 500   <-- server errors Googlebot is seeing
2. Most-Crawled URL Paths (Stripped of Parameters)
# Strip query strings, count URL frequency
awk '{print $7}' googlebot.log | cut -d? -f1 | sort | uniq -c | sort -rn | head -100

# Find which parameter-bearing URLs are most crawled
awk '{print $7}' googlebot.log | grep "\?" | sort | uniq -c | sort -rn | head -50

# Identify top parameter keys being crawled
awk '{print $7}' googlebot.log | grep "\?" | grep -oP '(?<=\?|&)[^=&]+(?==)' \
  | sort | uniq -c | sort -rn | head -30
3. Crawl Depth Analysis
# Count URL depth (path segments)
awk '{print $7}' googlebot.log | cut -d? -f1 | awk -F/ '{print NF-1}' \
  | sort -n | uniq -c

# Output:
# 1230  1  (homepage-level)
# 4502  2  (category-level)
# 8901  3  (subcategory/product-level)
#  234  4  (deep pages)
#   12  5  (very deep — investigate)
4. Crawl Rate Trend (Hourly)
# Hourly Googlebot request count
awk '{print $4}' googlebot.log | cut -d: -f1-3 | sed 's/\[//' | sort | uniq -c

# Daily trend over 30 days
awk '{print $4}' googlebot-30days.log | cut -d: -f1 | sed 's/\[//' | sort | uniq -c

# Find days with unusual crawl drops or spikes
awk '{print $4}' googlebot-30days.log | cut -d: -f1 | sed 's/\[//' \
  | sort | uniq -c | awk '$1 < 1000 || $1 > 50000 {print "ANOMALY:", $0}'
5. Response Time Analysis
# Requires extended log format with $request_time as last field
# Average response time for Googlebot crawls
awk '/Googlebot/{sum+=$NF; count++} END{print "Avg TTFB:", sum/count, "seconds"}' googlebot.log

# Pages with response time over 2 seconds
awk '/Googlebot/ && $NF > 2.0 {print $NF, $7}' googlebot.log | sort -rn | head -50

# Response time by URL path depth
awk '/Googlebot/{depth=split($7,a,"/"); print depth, $NF}' googlebot.log \
  | awk '{sum[$1]+=$2; count[$1]++} END{for(d in sum) print d, sum[d]/count[d]}' | sort -n
Enterprise Stack: Splunk, ELK, BigQuery
Splunk Dashboards for Crawl Monitoring
# Splunk SPL: Googlebot crawl efficiency over 30 days
index=web_logs user_agent="*Googlebot*" earliest=-30d
| eval has_params=if(like(uri_path, "%?%"), "parameterized", "clean")
| eval response_class=case(
    status=200, "success",
    status>=300 AND status<400, "redirect",
    status=404, "not_found",
    status>=500, "server_error",
    true(), "other"
)
| timechart span=1d count by response_class

# Find new URLs Googlebot discovered today (not seen in previous 7 days)
index=web_logs user_agent="*Googlebot*" earliest=-1d
| eval today_url=uri_path
| join type=left today_url
    [search index=web_logs user_agent="*Googlebot*" earliest=-8d latest=-1d
    | stats count by uri_path
    | rename uri_path as today_url]
| where isnull(count)
| stats count by today_url
Elasticsearch / Kibana
# ELK: Detect crawl rate anomalies
GET /nginx-logs-*/_search
{
  "size": 0,
  "query": {
    "bool": {
      "filter": [
        {"match": {"user_agent.original": "Googlebot"}},
        {"range": {"@timestamp": {"gte": "now-30d"}}}
      ]
    }
  },
  "aggs": {
    "crawl_by_day": {
      "date_histogram": {
        "field": "@timestamp",
        "calendar_interval": "day"
      },
      "aggs": {
        "by_status": {
          "terms": {"field": "http.response.status_code"}
        },
        "avg_response_time": {
          "avg": {"field": "event.duration"}
        }
      }
    }
  }
}
BigQuery for Scale
-- BigQuery: Analyze 90 days of Googlebot logs
-- (Assumes logs loaded from GCS via log export)
SELECT
  DATE(timestamp) as crawl_date,
  REGEXP_EXTRACT(request_url, r'^[^?]*') as url_path,
  status,
  COUNT(*) as request_count,
  AVG(latency) as avg_latency_seconds
FROM project.dataset.nginx_access_logs
WHERE
  user_agent LIKE '%Googlebot%'
  AND timestamp > TIMESTAMP_SUB(CURRENT_TIMESTAMP(), INTERVAL 90 DAY)
GROUP BY 1, 2, 3
HAVING request_count > 10
ORDER BY request_count DESC
LIMIT 1000;

-- Find pages crawled by Googlebot but never indexed (cross-join with GSC data)
SELECT
  l.url_path,
  COUNT(*) as crawl_count,
  MAX(l.crawl_date) as last_crawled,
  g.indexing_status
FROM googlebot_crawls l
LEFT JOIN gsc_coverage g ON l.url_path = g.url_path
WHERE g.indexing_status IS NULL OR g.indexing_status != 'Indexed'
GROUP BY l.url_path, g.indexing_status
ORDER BY crawl_count DESC;
Specialized SEO Log Tools
Screaming Frog Log Analyser
Screaming Frog's standalone Log Analyser is the fastest entry point for log analysis without infrastructure investment. Upload your log files directly. It parses Googlebot user-agent variants automatically, segments by bot type, and provides pre-built reports for: most crawled URLs, response code trends, crawl frequency by page type, and new URLs discovered.
Key workflow: after uploading logs, cross-reference with a Screaming Frog crawl of the same period. The combined view shows: pages crawled by Googlebot that Screaming Frog found broken (revealing what Google sees vs. what you think exists), and pages in your sitemap that Googlebot never visited (crawl prioritization signal).
OnCrawl
OnCrawl's log analysis correlates crawl data with Google Analytics and GSC data. The "crawl vs. performance" matrix is particularly useful — it shows pages in four quadrants: crawled+converting, crawled+not converting, not crawled+converting (Google caches these — investigate), not crawled+not converting (orphan pages).
Botify
Botify is the most powerful enterprise log analysis tool, but also the most expensive. Its FastIndex feature tracks the crawl-to-index pipeline with actual latency data. The key report: "crawl lag histogram" — showing how many days between a page being crawled and appearing in GSC as indexed. When this lag increases, it's an early warning of either content quality issues or crawl budget pressure.
Red Flags and What They Mean
| Log Pattern | What It Means | Investigation Path |
|---|---|---|
| >20% of Googlebot requests return 301/302 | Redirect chain waste; old URLs still linked internally | Find source pages linking to these URLs; update internal links |
| Googlebot-Smartphone and Googlebot-Desktop crawling different URLs | Mobile rendering issue; different content served to each | Check mobile vs. desktop rendering in GSC URL inspection |
| Sudden 40%+ drop in daily Googlebot requests | Server error period that caused crawl rate reduction; robots.txt change; site structure change | Check server error logs for same period; verify robots.txt history |
| Parameter URLs in top 50 most-crawled | Crawl budget drain; parameter handling not configured | Block via robots.txt or implement canonical tags |
| Avg Googlebot response time > 1.5s | Server performance limiting crawl rate | Profile slow endpoints; check database query time; implement caching |
| High-priority pages crawled < once per week | Low crawl demand signal; insufficient internal linking | Audit internal link depth; add links from high-authority pages |
| 404 rate > 5% of Googlebot requests | Broken internal links or external links pointing to deleted pages | Find referring pages via log referer field; fix or 301 redirect |
FAQ
How long should I keep log files for SEO analysis?
Minimum 90 days. 12 months is better for identifying seasonal crawl patterns. Storage is cheap relative to the insight value. Compress with gzip (nginx logs compress 10:1 typically) and store on S3 or GCS. If you're under GDPR, log files containing IP addresses may have retention constraints — consult your legal team, but anonymizing the last octet of IP addresses satisfies most requirements while preserving SEO utility.
What if my site is behind Cloudflare and origin logs don't capture all requests?
Use Cloudflare's Logpush to export logs to R2, S3, or a SIEM. Cloudflare logs at the edge capture every request including those served from cache — which origin logs never see. For SEO purposes, edge logs are actually more useful because they show the complete Googlebot request history including cache-hit requests that demonstrate how frequently Google checks for fresh content.
How do I distinguish real Googlebot from Googlebot impersonators in logs?
Two methods: (1) Cross-reference the IP against Google's published IP ranges at https://developers.google.com/search/apis/ipranges/googlebot.json. (2) Reverse DNS lookup: host 66.249.75.30 — a real Googlebot IP resolves to a *.googlebot.com hostname. Forward DNS from that hostname should resolve back to the original IP. Impersonators typically use IPs that don't pass this forward/reverse DNS check.
My log files show Googlebot crawling pages that are in my sitemap but marked noindex. Why?
Because noindex is a directive, not a block. You've invited Googlebot via the sitemap, so it visits. When it arrives and sees the noindex, it honors it but still expended a crawl request. Remove noindex pages from sitemaps to eliminate this waste. Also, Googlebot needs to periodically re-check noindex pages to verify the directive is still present — if you added noindex years ago, expect occasional crawls even without sitemap inclusion.
Can log analysis tell me which pages Googlebot renders vs. just fetches?
Not directly from standard access logs. Googlebot renders JavaScript using a Chromium-based renderer — the initial HTML fetch and the rendered resource requests (CSS, JS, images) all appear in logs. You can infer rendering by looking for associated resource requests following the main HTML request from the same Googlebot IP within seconds. Full rendering confirmation requires GSC's URL Inspection "Rich results" test or comparing rendered content in GSC vs. the source HTML.
Key Takeaways
- Log files are the ground truth of what Googlebot actually does — everything else is a proxy. Set up log access and collection before you need it in a crisis.
- For enterprise sites, route logs through ELK, Splunk, or BigQuery. Command-line analysis on raw logs doesn't scale beyond a few million daily requests.
- Crawl efficiency score (200s to canonical URLs / total Googlebot requests) is your headline KPI. Measure it weekly.
- Parameter-heavy URLs in your top 50 most-crawled list is the most common finding and the highest-priority fix.
- Googlebot-Smartphone vs. Googlebot-Desktop crawl divergence is a mobile rendering red flag that will impact rankings.
- CDN-layer logs are more complete than origin logs. Configure log export from your CDN if you use one.
- Correlate log data with GSC and GA data. Pages that convert but aren't crawled, or are crawled but never indexed, are each actionable categories requiring different fixes.
For the next step after identifying crawl issues — fixing redirect chains and soft 404s found in logs — see the soft 404s and redirect chains guide. For the larger crawl budget strategy, read the crawl budget optimization guide.