The Google Search Console UI is a toy for the scale of analysis that actually drives decisions. 16-month data retention, 1,000-row export limits, no cross-property queries, no JOIN capabilities — it's a dashboard for sanity checks, not a decision engine. BigQuery with the linked GSC export removes every one of those constraints. This article covers the full pipeline: linking exports, schema internalization, the SQL patterns that yield real insights, and the Python orchestration layer that makes it operational.
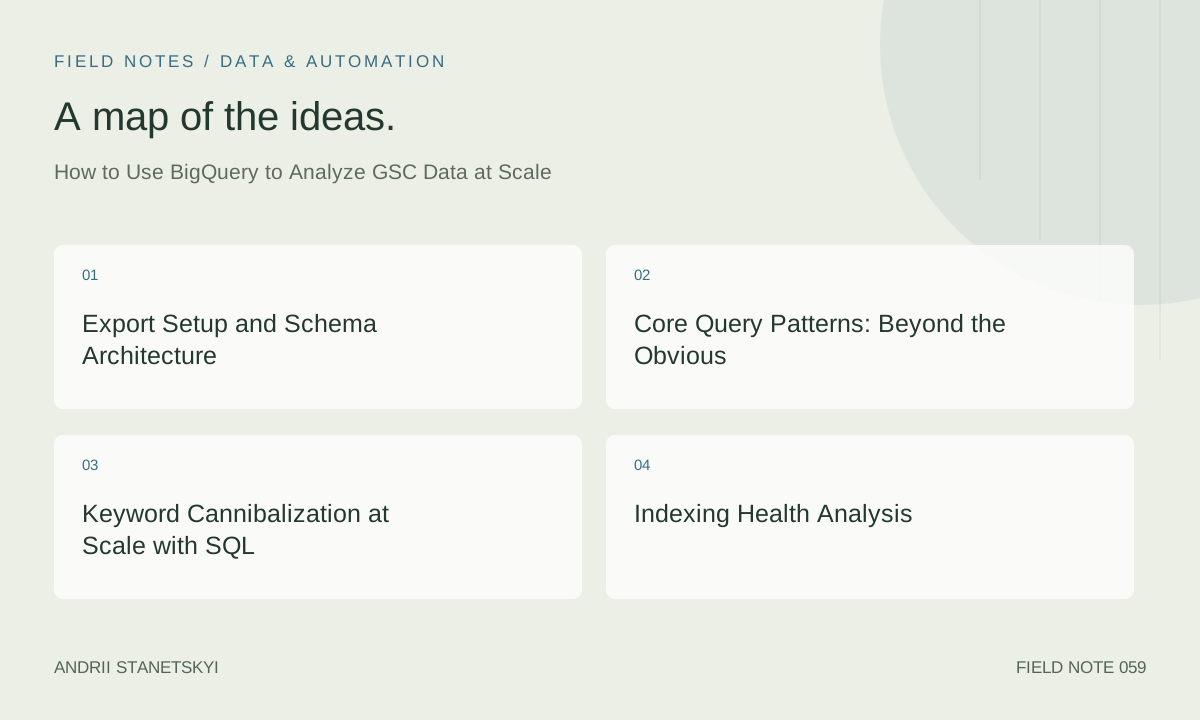
Export Setup and Schema Architecture
The BigQuery GSC linked export creates two tables in your BigQuery dataset: searchdata_site_impression (site-level query data) and searchdata_url_impression (URL-level query data). Both are partitioned by data_date. The URL-level table has significantly higher cardinality and daily volume — for large sites, it can reach hundreds of millions of rows per day.
Table Schema Reference
| Field | Type | Table | Notes |
|---|---|---|---|
| data_date | DATE | Both | Partition field — always filter on this |
| site_url | STRING | Both | sc-domain: prefix for domain properties |
| url | STRING | url_impression only | Full canonical URL as seen by GSC |
| query | STRING | Both | NULL for queries below anonymization threshold |
| is_anonymized_query | BOOL | Both | TRUE when query is withheld |
| country | STRING | Both | ISO 3166-1 alpha-3 (e.g., "USA", "GBR") |
| search_type | STRING | Both | WEB, IMAGE, VIDEO, NEWS, DISCOVER, GOOGLE_NEWS |
| impressions | INT64 | Both | Rounded for low-traffic signals |
| clicks | INT64 | Both | Rounded for low-traffic signals |
| sum_position | FLOAT64 | Both | Sum of 0-indexed positions (divide by impressions for avg) |
| is_anonymized_discover | BOOL | Both | Google Discover anonymization flag |
Critical nuance: sum_position is the sum of positions, not the average. Always compute sum_position / impressions for average position. Using sum_position directly is one of the most common BigQuery GSC analysis errors. Also: positions are 0-indexed in the raw data, so add 1 for display.
Core Query Patterns: Beyond the Obvious
30/60/90-Day Rolling Performance with WoW Comparison
-- Rolling 28-day performance with prior period comparison
-- Useful for YoY, MoM, WoW trend analysis at query level

WITH current_period AS (
  SELECT
    query,
    SUM(clicks) AS clicks,
    SUM(impressions) AS impressions,
    SAFE_DIVIDE(SUM(clicks), SUM(impressions)) AS ctr,
    SAFE_DIVIDE(SUM(sum_position), SUM(impressions)) + 1 AS avg_position
  FROM your-project.gsc_export.searchdata_site_impression
  WHERE
    data_date BETWEEN DATE_SUB(CURRENT_DATE(), INTERVAL 28 DAY) AND DATE_SUB(CURRENT_DATE(), INTERVAL 1 DAY)
    AND search_type = 'WEB'
    AND NOT is_anonymized_query
    AND country = 'USA'
  GROUP BY query
),
prior_period AS (
  SELECT
    query,
    SUM(clicks) AS clicks,
    SUM(impressions) AS impressions,
    SAFE_DIVIDE(SUM(clicks), SUM(impressions)) AS ctr,
    SAFE_DIVIDE(SUM(sum_position), SUM(impressions)) + 1 AS avg_position
  FROM your-project.gsc_export.searchdata_site_impression
  WHERE
    data_date BETWEEN DATE_SUB(CURRENT_DATE(), INTERVAL 56 DAY) AND DATE_SUB(CURRENT_DATE(), INTERVAL 29 DAY)
    AND search_type = 'WEB'
    AND NOT is_anonymized_query
    AND country = 'USA'
  GROUP BY query
)

SELECT
  c.query,
  c.clicks AS current_clicks,
  p.clicks AS prior_clicks,
  c.impressions AS current_impressions,
  p.impressions AS prior_impressions,
  ROUND(c.avg_position, 1) AS current_position,
  ROUND(p.avg_position, 1) AS prior_position,
  ROUND(c.avg_position - p.avg_position, 1) AS position_delta,
  ROUND((c.clicks - p.clicks) / NULLIF(p.clicks, 0) * 100, 1) AS click_growth_pct,
  ROUND((c.impressions - p.impressions) / NULLIF(p.impressions, 0) * 100, 1) AS impression_growth_pct,
  -- Classify movement type
  CASE
    WHEN c.avg_position < p.avg_position AND c.clicks > p.clicks THEN 'improving_gainers'
    WHEN c.avg_position > p.avg_position AND c.clicks < p.clicks THEN 'declining_losers'
    WHEN c.avg_position < p.avg_position AND c.clicks <= p.clicks THEN 'position_up_clicks_flat'
    WHEN c.avg_position > p.avg_position AND c.clicks >= p.clicks THEN 'position_down_clicks_flat'
    ELSE 'stable'
  END AS movement_type
FROM current_period c
FULL OUTER JOIN prior_period p USING (query)
WHERE c.impressions >= 100  -- Significance threshold
ORDER BY ABS(c.clicks - p.clicks) DESC
LIMIT 1000;
CTR Opportunity Analysis: High Impression, Low CTR
-- Find queries where you rank well but have abnormally low CTR
-- CTR benchmarks by position: P1=~28%, P2=~15%, P3=~11%, P4=~8%, P5-10=~2-5%

WITH position_benchmarks AS (
  SELECT
    benchmark_position,
    expected_ctr
  FROM UNNEST([
    STRUCT(1.0 AS benchmark_position, 0.28 AS expected_ctr),
    STRUCT(2.0, 0.15),
    STRUCT(3.0, 0.11),
    STRUCT(4.0, 0.08),
    STRUCT(5.0, 0.065),
    STRUCT(6.0, 0.05),
    STRUCT(7.0, 0.04),
    STRUCT(8.0, 0.035),
    STRUCT(9.0, 0.03),
    STRUCT(10.0, 0.025)
  ])
),
query_performance AS (
  SELECT
    query,
    SUM(clicks) AS clicks,
    SUM(impressions) AS impressions,
    ROUND(SAFE_DIVIDE(SUM(clicks), SUM(impressions)), 4) AS actual_ctr,
    ROUND(SAFE_DIVIDE(SUM(sum_position), SUM(impressions)) + 1, 1) AS avg_position
  FROM your-project.gsc_export.searchdata_site_impression
  WHERE
    data_date >= DATE_SUB(CURRENT_DATE(), INTERVAL 28 DAY)
    AND search_type = 'WEB'
    AND NOT is_anonymized_query
  GROUP BY query
  HAVING SUM(impressions) >= 500 AND avg_position <= 10
)

SELECT
  qp.query,
  qp.avg_position,
  qp.actual_ctr,
  pb.expected_ctr,
  ROUND(pb.expected_ctr - qp.actual_ctr, 4) AS ctr_gap,
  ROUND((pb.expected_ctr - qp.actual_ctr) * qp.impressions) AS estimated_lost_clicks,
  qp.impressions,
  qp.clicks
FROM query_performance qp
JOIN position_benchmarks pb
  ON ROUND(qp.avg_position) = pb.benchmark_position
WHERE qp.actual_ctr < pb.expected_ctr * 0.6  -- More than 40% below expected
ORDER BY estimated_lost_clicks DESC
LIMIT 200;
Keyword Cannibalization at Scale with SQL
True cannibalization in GSC data is when multiple URLs compete for the same query and Google serves different URLs across sessions, degrading average position for all of them. The signature: one query, multiple URLs with impressions, no URL consistently dominant.
-- Detect keyword cannibalization: queries served by multiple URLs
-- with no clear dominant URL (dominance < 80% of impressions)

WITH query_url_share AS (
  SELECT
    query,
    url,
    SUM(impressions) AS impressions,
    SUM(clicks) AS clicks,
    ROUND(SAFE_DIVIDE(SUM(sum_position), SUM(impressions)) + 1, 1) AS avg_position,
    SUM(SUM(impressions)) OVER (PARTITION BY query) AS total_query_impressions,
    ROUND(
      SAFE_DIVIDE(SUM(impressions), SUM(SUM(impressions)) OVER (PARTITION BY query)),
      4
    ) AS url_impression_share
  FROM your-project.gsc_export.searchdata_url_impression
  WHERE
    data_date >= DATE_SUB(CURRENT_DATE(), INTERVAL 28 DAY)
    AND search_type = 'WEB'
    AND NOT is_anonymized_query
  GROUP BY query, url
  HAVING SUM(impressions) >= 20
),

cannibalization_candidates AS (
  SELECT
    query,
    COUNT(DISTINCT url) AS competing_urls,
    MAX(url_impression_share) AS max_url_share,
    MIN(avg_position) AS best_position,
    MAX(avg_position) AS worst_position,
    SUM(impressions) AS total_impressions,
    SUM(clicks) AS total_clicks,
    ARRAY_AGG(
      STRUCT(url, impressions, clicks, avg_position, url_impression_share)
      ORDER BY impressions DESC
      LIMIT 5
    ) AS url_breakdown
  FROM query_url_share
  GROUP BY query
  HAVING
    COUNT(DISTINCT url) >= 2
    AND MAX(url_impression_share) < 0.80  -- No dominant URL
    AND SUM(impressions) >= 100
)

SELECT
  query,
  competing_urls,
  ROUND(max_url_share * 100, 1) AS dominant_url_share_pct,
  best_position,
  worst_position,
  ROUND(worst_position - best_position, 1) AS position_spread,
  total_impressions,
  total_clicks,
  ROUND(SAFE_DIVIDE(total_clicks, total_impressions) * 100, 2) AS ctr_pct,
  url_breakdown
FROM cannibalization_candidates
ORDER BY total_impressions DESC
LIMIT 500;
Indexing Health Analysis
Combining GSC URL impression data with your sitemap creates a powerful index coverage audit: which URLs in your sitemap are getting zero impressions (never ranked), which are getting impressions but no clicks (title/description issues), and which aren't in GSC at all (indexing failures).
-- Load sitemap URLs into BigQuery for join analysis
-- Assumes you have a sitemap_urls table with columns: url, priority, changefreq, lastmod

CREATE TABLE IF NOT EXISTS your-project.seo.sitemap_urls
(
  url STRING,
  priority FLOAT64,
  changefreq STRING,
  lastmod DATE,
  ingested_at TIMESTAMP
)
PARTITION BY DATE(ingested_at);

-- Coverage analysis: sitemap vs. GSC impressions
WITH gsc_url_summary AS (
  SELECT
    url,
    SUM(impressions) AS total_impressions,
    SUM(clicks) AS total_clicks,
    COUNT(DISTINCT data_date) AS days_with_data,
    MIN(data_date) AS first_seen,
    MAX(data_date) AS last_seen,
    ROUND(SAFE_DIVIDE(SUM(sum_position), SUM(impressions)) + 1, 1) AS avg_position
  FROM your-project.gsc_export.searchdata_url_impression
  WHERE
    data_date >= DATE_SUB(CURRENT_DATE(), INTERVAL 90 DAY)
    AND search_type = 'WEB'
  GROUP BY url
)

SELECT
  s.url,
  s.priority AS sitemap_priority,
  s.lastmod,
  COALESCE(g.total_impressions, 0) AS impressions_90d,
  COALESCE(g.total_clicks, 0) AS clicks_90d,
  g.avg_position,
  g.days_with_data,
  g.first_seen,
  -- Classify indexing status
  CASE
    WHEN g.url IS NULL THEN 'not_in_gsc'
    WHEN g.total_impressions = 0 THEN 'gsc_no_impressions'
    WHEN g.total_impressions < 10 THEN 'minimal_visibility'
    WHEN g.avg_position > 50 AND g.total_impressions >= 10 THEN 'deeply_buried'
    WHEN g.avg_position BETWEEN 11 AND 50 AND g.total_impressions >= 10 THEN 'page2_plus'
    WHEN g.avg_position <= 10 THEN 'page1_visibility'
    ELSE 'other'
  END AS visibility_status
FROM your-project.seo.sitemap_urls s
LEFT JOIN gsc_url_summary g ON s.url = g.url
WHERE DATE(s.ingested_at) = (
  SELECT MAX(DATE(ingested_at)) FROM your-project.seo.sitemap_urls
)
ORDER BY impressions_90d DESC;
Automated Trend Detection and Alerting
Statistical trend detection on BigQuery GSC data means moving beyond manual checks to algorithmic identification of anomalies. The most useful patterns: week-over-week drops on high-value queries, unusual CTR deterioration, and position cliff events.
-- Detect position cliff events: queries that dropped 5+ positions week-over-week
-- on URLs with significant traffic investment

WITH daily_position AS (
  SELECT
    data_date,
    url,
    query,
    SAFE_DIVIDE(SUM(sum_position), SUM(impressions)) + 1 AS avg_position,
    SUM(impressions) AS impressions
  FROM your-project.gsc_export.searchdata_url_impression
  WHERE
    data_date >= DATE_SUB(CURRENT_DATE(), INTERVAL 14 DAY)
    AND search_type = 'WEB'
    AND NOT is_anonymized_query
  GROUP BY data_date, url, query
),

weekly_avg AS (
  SELECT
    url,
    query,
    AVG(IF(data_date >= DATE_SUB(CURRENT_DATE(), INTERVAL 7 DAY), avg_position, NULL)) AS pos_current_week,
    AVG(IF(data_date < DATE_SUB(CURRENT_DATE(), INTERVAL 7 DAY), avg_position, NULL)) AS pos_prior_week,
    SUM(IF(data_date >= DATE_SUB(CURRENT_DATE(), INTERVAL 7 DAY), impressions, 0)) AS impr_current,
    SUM(IF(data_date < DATE_SUB(CURRENT_DATE(), INTERVAL 7 DAY), impressions, 0)) AS impr_prior
  FROM daily_position
  GROUP BY url, query
  HAVING
    impr_current >= 50
    AND impr_prior >= 50
    AND pos_prior_week IS NOT NULL
    AND pos_current_week IS NOT NULL
)

SELECT
  url,
  query,
  ROUND(pos_prior_week, 1) AS position_last_week,
  ROUND(pos_current_week, 1) AS position_this_week,
  ROUND(pos_current_week - pos_prior_week, 1) AS position_drop,
  impr_prior AS impressions_last_week,
  impr_current AS impressions_this_week,
  -- Estimated click loss (using P10 CTR ~ 2.5% as baseline)
  ROUND((pos_current_week - pos_prior_week) * 0.025 * impr_current) AS estimated_click_loss
FROM weekly_avg
WHERE
  pos_current_week > pos_prior_week + 5  -- Position drop of 5+
  AND pos_prior_week <= 20  -- Was previously ranking on first 2 pages
ORDER BY position_drop DESC
LIMIT 200;
Python: Scheduled BigQuery Alert Runner
import os
from google.cloud import bigquery
import smtplib
from email.mime.text import MIMEText
from email.mime.multipart import MIMEMultipart
import pandas as pd
PROJECT_ID = "your-project"
DATASET = "gsc_export"
ALERT_QUERIES = {
"position_cliff": """
-- Paste the position cliff query from above
SELECT url, query, position_drop, impressions_this_week
FROM (/* weekly_avg CTE */)
WHERE position_drop >= 10 AND impressions_this_week >= 100
ORDER BY position_drop DESC LIMIT 20
""",
"ctr_crash": """
WITH base AS (
SELECT
url,
query,
SAFE_DIVIDE(
SUM(IF(data_date >= DATE_SUB(CURRENT_DATE(), INTERVAL 7 DAY), clicks, 0)),
NULLIF(SUM(IF(data_date >= DATE_SUB(CURRENT_DATE(), INTERVAL 7 DAY), impressions, 0)), 0)
) AS ctr_current,
SAFE_DIVIDE(
SUM(IF(data_date BETWEEN DATE_SUB(CURRENT_DATE(), INTERVAL 14 DAY)
AND DATE_SUB(CURRENT_DATE(), INTERVAL 8 DAY), clicks, 0)),
NULLIF(SUM(IF(data_date BETWEEN DATE_SUB(CURRENT_DATE(), INTERVAL 14 DAY)
AND DATE_SUB(CURRENT_DATE(), INTERVAL 8 DAY), impressions, 0)), 0)
) AS ctr_prior,
SUM(IF(data_date >= DATE_SUB(CURRENT_DATE(), INTERVAL 7 DAY), impressions, 0)) AS impr
FROM your-project.gsc_export.searchdata_url_impression
WHERE data_date >= DATE_SUB(CURRENT_DATE(), INTERVAL 14 DAY)
AND search_type = 'WEB'
GROUP BY url, query
)
SELECT url, query,
ROUND(ctr_prior * 100, 2) AS ctr_prior_pct,
ROUND(ctr_current * 100, 2) AS ctr_current_pct,
ROUND((ctr_current - ctr_prior) * 100, 2) AS ctr_delta_pp,
impr
FROM base
WHERE impr >= 200 AND ctr_prior > 0 AND ctr_current / ctr_prior < 0.6
ORDER BY impr DESC LIMIT 20
"""
}
def run_alerts(recipient_email: str):
bq = bigquery.Client(project=PROJECT_ID)
alerts = {}
for alert_name, sql in ALERT_QUERIES.items():
df = bq.query(sql).to_dataframe()
if not df.empty:
alerts[alert_name] = df
if not alerts:
print("No alerts triggered.")
return
# Build email
body = "GSC Automated Alerts
\n"
for name, df in alerts.items():
body += f"{name.replace('_', ' ').title()}
\n"
body += df.to_html(index=False, border=1)
body += "\n"
msg = MIMEMultipart("alternative")
msg["Subject"] = f"GSC Alert: {len(alerts)} issue(s) detected"
msg["From"] = "[email protected]"
msg["To"] = recipient_email
msg.attach(MIMEText(body, "html"))
# Send (configure your SMTP credentials)
with smtplib.SMTP_SSL("smtp.gmail.com", 465) as server:
server.login("user", "app_password")
server.sendmail(msg["From"], recipient_email, msg.as_string())
print(f"Alert email sent: {len(alerts)} alert types triggered")
Python Orchestration Layer
See our Looker Studio dashboard guide that uses these BigQuery tables as data sourcesfrom google.cloud import bigquery
import pandas as pd
from datetime import datetime, timedelta
import json
class GSCBigQueryClient:
"""
Wrapper for common GSC BigQuery analysis patterns.
Handles partition pruning, query parameterization, and result caching.
"""
def __init__(self, project_id: str, dataset_id: str = "gsc_export"):
self.client = bigquery.Client(project=project_id)
self.project = project_id
self.dataset = dataset_id
self.site_table = f"{project_id}.{dataset_id}.searchdata_site_impression"
self.url_table = f"{project_id}.{dataset_id}.searchdata_url_impression"
def get_top_queries(
self,
days: int = 28,
country: str = "USA",
search_type: str = "WEB",
min_impressions: int = 100,
limit: int = 1000
) -> pd.DataFrame:
"""Fetch top queries by clicks for the given period."""
sql = f"""
SELECT
query,
SUM(clicks) AS clicks,
SUM(impressions) AS impressions,
ROUND(SAFE_DIVIDE(SUM(clicks), SUM(impressions)) * 100, 2) AS ctr_pct,
ROUND(SAFE_DIVIDE(SUM(sum_position), SUM(impressions)) + 1, 1) AS avg_position
FROM {self.site_table}
WHERE
data_date >= DATE_SUB(CURRENT_DATE(), INTERVAL {days} DAY)
AND search_type = @search_type
AND country = @country
AND NOT is_anonymized_query
GROUP BY query
HAVING SUM(impressions) >= {min_impressions}
ORDER BY clicks DESC
LIMIT {limit}
"""
job_config = bigquery.QueryJobConfig(
query_parameters=[
bigquery.ScalarQueryParameter("search_type", "STRING", search_type),
bigquery.ScalarQueryParameter("country", "STRING", country),
]
)
return self.client.query(sql, job_config=job_config).to_dataframe()
def get_url_query_matrix(
self,
url_pattern: str,
days: int = 28,
min_impressions: int = 10
) -> pd.DataFrame:
"""Get all query/URL pairs for URLs matching a pattern."""
sql = f"""
SELECT
url,
query,
SUM(clicks) AS clicks,
SUM(impressions) AS impressions,
ROUND(SAFE_DIVIDE(SUM(sum_position), SUM(impressions)) + 1, 1) AS avg_position
FROM {self.url_table}
WHERE
data_date >= DATE_SUB(CURRENT_DATE(), INTERVAL {days} DAY)
AND search_type = 'WEB'
AND REGEXP_CONTAINS(url, @url_pattern)
AND NOT is_anonymized_query
GROUP BY url, query
HAVING SUM(impressions) >= {min_impressions}
ORDER BY impressions DESC
"""
job_config = bigquery.QueryJobConfig(
query_parameters=[
bigquery.ScalarQueryParameter("url_pattern", "STRING", url_pattern),
]
)
return self.client.query(sql, job_config=job_config).to_dataframe()
def detect_algorithm_update_impact(
self,
update_date: str,
pre_days: int = 14,
post_days: int = 14
) -> dict:
"""
Measure aggregate position and click changes around a suspected algorithm update date.
update_date: 'YYYY-MM-DD' string
"""
sql = f"""
WITH pre AS (
SELECT
ROUND(SAFE_DIVIDE(SUM(sum_position), SUM(impressions)) + 1, 2) AS avg_position,
SUM(clicks) AS total_clicks,
SUM(impressions) AS total_impressions
FROM {self.site_table}
WHERE
data_date BETWEEN DATE_SUB('{update_date}', INTERVAL {pre_days} DAY)
AND DATE_SUB('{update_date}', INTERVAL 1 DAY)
AND search_type = 'WEB'
AND NOT is_anonymized_query
),
post AS (
SELECT
ROUND(SAFE_DIVIDE(SUM(sum_position), SUM(impressions)) + 1, 2) AS avg_position,
SUM(clicks) AS total_clicks,
SUM(impressions) AS total_impressions
FROM {self.site_table}
WHERE
data_date BETWEEN '{update_date}' AND DATE_ADD('{update_date}', INTERVAL {post_days} DAY)
AND search_type = 'WEB'
AND NOT is_anonymized_query
)
SELECT
pre.avg_position AS pre_position,
post.avg_position AS post_position,
ROUND(post.avg_position - pre.avg_position, 2) AS position_delta,
pre.total_clicks AS pre_clicks,
post.total_clicks AS post_clicks,
ROUND((post.total_clicks - pre.total_clicks) / pre.total_clicks * 100, 1) AS click_change_pct,
pre.total_impressions AS pre_impressions,
post.total_impressions AS post_impressions
FROM pre, post
"""
result = self.client.query(sql).to_dataframe()
return result.to_dict(orient="records")[0] if not result.empty else {}
FAQ
Q: Why does BigQuery GSC data sometimes differ from the GSC UI by 10–20%?
Multiple reasons compound: (1) The UI applies different sampling for high-traffic properties. (2) The BigQuery export aggregates data differently for impression counting when a URL appears multiple times in a single SERP. (3) The 28-hour export delay means you're comparing slightly different date windows. (4) The UI applies a "500 clicks minimum to show" filter on some views that BigQuery doesn't enforce. The BigQuery export is generally more complete and reliable — treat UI numbers as directional, BigQuery as the source of truth.
Q: How do I handle the 16-month data retention limit in the BigQuery export?
Build a snapshot table that preserves aggregated monthly data before it ages out. Create a scheduled query that runs on the 1st of each month and writes the prior month's aggregated data (query, site, impressions, clicks, avg_position) to a long-term archive table. The raw daily data will expire from the linked export tables, but your monthly aggregates can persist indefinitely. Critical: start this immediately, before you lose the first window.
Q: What's the best way to join GSC data with Google Analytics 4 data in BigQuery?
Both GA4 and GSC exports can coexist in BigQuery. The join key is the page URL — use REGEXP_REPLACE to normalize trailing slashes and protocol differences before joining. Note that GA4 exports use session-level data while GSC is impression-level, so joins require aggregation to the page level first. The most useful join: GSC organic clicks → GA4 sessions from organic → GA4 conversions, to compute organic conversion rates per query cluster.
Q: How can I identify Discover traffic separately from Web Search in the export?
Filter on search_type = 'DISCOVER'. Note that Discover traffic has significantly higher impression counts but near-zero query data (most queries are NULL or anonymized). For Discover analysis, focus on url as the primary dimension and use engagement metrics from GA4 via join rather than GSC click rates, since Discover CTR is structurally different from Search CTR.
Q: What's a practical approach to deduplicate the URL table when the same URL appears under multiple variants?
Use REGEXP_REPLACE to normalize URLs before grouping: strip UTM parameters, normalize trailing slashes, lowercase, and strip www. prefix. Create a URL normalization function in BigQuery as a persistent UDF, then apply it consistently across all analytical queries. Also consider joining against your canonical URL map (if maintained in BigQuery) to map all variants to their canonical.
Q: How do I identify the impact of Core Web Vitals improvements on GSC performance?
Use a difference-in-differences approach: segment URLs by CWV improvement timing (from CrUX data, also available in BigQuery), then compare position and click trends for improved vs. unimproved pages across the same date range. URLs that improved CWV before an update date serve as your treatment group; those unchanged serve as control. Normalize for initial position to avoid selection bias.
Key Takeaways
sum_positionis a sum, not an average — always computesum_position / impressions + 1for average position. This mistake is endemic in BigQuery GSC analysis.- Always filter on
data_datein every query — without a date filter, BigQuery scans the entire partitioned table, turning a $0.01 query into a $10+ scan. - The position cliff detection query (WoW drop ≥ 5 positions on URLs with significant impressions) should run as a scheduled query daily and feed your alerting pipeline.
- CTR opportunity analysis — high impression, below-expected CTR — is typically a title tag and meta description optimization problem, not a content depth problem.
- Build the monthly snapshot job before you need it; the 16-month export retention window disappears with no warning and no recovery path.
- The GSCBigQueryClient wrapper pattern makes query parameterization and partition pruning consistent across your analysis scripts — a small infrastructure investment that prevents expensive mistakes.
Conclusion
BigQuery-linked GSC exports transform SEO analysis from sampled, time-limited, manually explored data into a queryable historical record that can feed automated alerting, trend detection, and cross-system analysis. The SQL patterns in this article are the foundation of a production-grade SEO intelligence system. Run them on a schedule, store outputs in separate analysis tables, and build your Looker Studio dashboards on top of those — not on raw query results. That's the architecture that scales.
Next: Building a Senior-Grade SEO Dashboard with Looker Studio and APIs Google Search Console BigQuery Export Schema Documentation