Published 19 May 2026 · Andrii · ~3,100 words
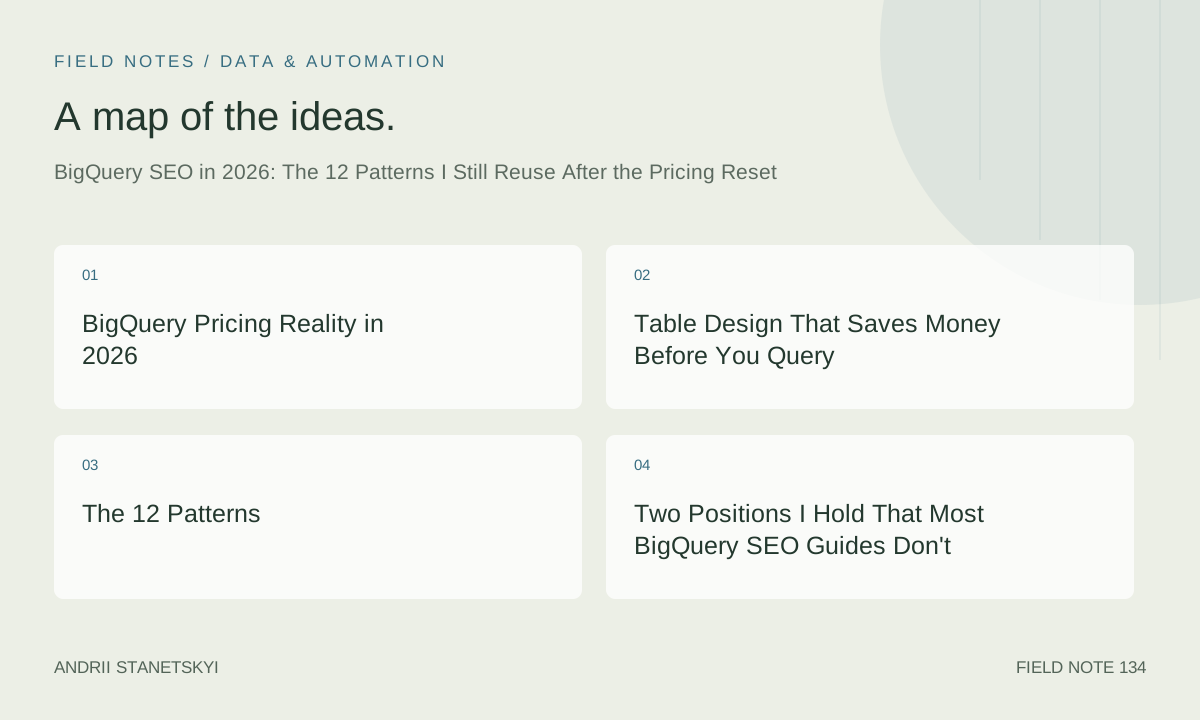
BigQuery Pricing Reality in 2026
Google reset BigQuery's on-demand pricing in mid-2025. The headline number is $6.25 per TB scanned. That's down from $6.25/TB — actually unchanged in USD from before, but the way bytes are counted changed for partitioned tables. Specifically, partition pruning is now applied before byte counting for billing purposes on tables with DATE or TIMESTAMP partitioning, which means a query that previously billed for 500 GB (full scan) now bills for the actual partitions read. This is genuinely better for SEO workloads that query by date range.
The free tier is 1 TB/month of query processing. For most individuals running personal analyses this covers everything. For team workloads across multiple analysts it disappears fast.
BigQuery Editions pricing (Enterprise, Enterprise Plus) starts at $0.044/slot-hour. To beat on-demand pricing with Editions you need sustained, predictable query loads. SEO analytical work is characteristically bursty — nothing for hours, then a flurry of queries during an audit or investigation. On-demand wins for almost every SEO team I've talked to.
| Scenario | Table size | Partitioned? | Cost per query |
|---|---|---|---|
| GSC export, 1 year, date-filtered | 120 GB | Yes (DATE) | $0.04–$0.18 |
| GSC export, 1 year, no partition filter | 120 GB | Yes (DATE) | $0.75 |
| GSC export, 1 year, unpartitioned | 120 GB | No | $0.75 |
| Log rollup join with GSC, 90 days | ~40 GB joined | Both partitioned | $0.25 |
| GA4 BigQuery export, 6 months sessions | ~800 GB | Yes (event_date) | $0.80–$2.10 |
| GA4 event table, SELECT *, 6 months | ~800 GB | Yes | $5.00 |
The SELECT * row is there for a reason. It's the most expensive single habit in BigQuery SEO work.
Table Design That Saves Money Before You Query
Every table in my SEO BigQuery dataset follows the same structure. Partition by DATE type column named date. Cluster by the two or three columns most frequently used in WHERE clauses and JOIN conditions. Require a partition filter — BigQuery's require_partition_filter option throws an error if a query doesn't include a partition filter, which prevents accidental full-table scans from analysts who are in a hurry.
-- Table DDL for GSC search analytics data
CREATE TABLE IF NOT EXISTS project.seo_data.gsc_searchanalytics
(
  date            DATE NOT NULL,
  site            STRING NOT NULL,
  query           STRING,
  page            STRING,
  country         STRING,
  device          STRING,
  clicks          INT64,
  impressions     INT64,
  ctr             FLOAT64,
  position        FLOAT64,
  -- derived fields added at load time
  query_word_count  INT64,
  page_type         STRING,
  branded           BOOL
)
PARTITION BY date
CLUSTER BY site, page, query
OPTIONS (
  require_partition_filter = TRUE,
  partition_expiration_days = 730,
  description = "GSC Search Analytics export. Partitioned by date, clustered by site/page/query."
);
Setting partition_expiration_days = 730 enforces automatic deletion at two years. GSC only gives you 16 months through the UI anyway, but if you're backfilling historical data from the API you might accumulate more. Automatic expiration prevents silent storage cost growth.
The 12 Patterns
Patterns 1–3: GSC Fundamentals
Pattern 1: Click-weighted average position. The default "average position" in GSC weights all queries equally. A query with 1,000 impressions and position 8 has the same weight as a query with 2 impressions and position 1. Click-weighting gives a more useful signal for prioritization.
-- Pattern 1: Click-weighted average position by page, last 90 days
SELECT
  page,
  SUM(clicks)                                        AS total_clicks,
  SUM(impressions)                                   AS total_impressions,
  SAFE_DIVIDE(SUM(clicks), SUM(impressions))         AS overall_ctr,
  -- Simple average (misleading)
  AVG(position)                                      AS avg_position_unweighted,
  -- Impression-weighted average (better)
  SAFE_DIVIDE(SUM(position * impressions), SUM(impressions)) AS avg_position_imp_weighted,
  -- Click-weighted average (best for commercial pages)
  SAFE_DIVIDE(SUM(position * clicks), SUM(clicks))   AS avg_position_click_weighted
FROM project.seo_data.gsc_searchanalytics
WHERE date BETWEEN DATE_SUB(CURRENT_DATE(), INTERVAL 90 DAY) AND CURRENT_DATE()
  AND site = 'sc-domain:example.com'
  AND clicks > 0
GROUP BY page
ORDER BY total_clicks DESC
LIMIT 500;
Pattern 2: Query-page mapping entropy. Each query should ideally have one primary landing page. When a query sends clicks to 5 different pages, you have a cannibalization signal. This query surfaces that.
-- Pattern 2: Queries mapping to multiple pages (cannibalization candidates)
SELECT
  query,
  COUNT(DISTINCT page)                  AS page_count,
  SUM(clicks)                           AS total_clicks,
  SUM(impressions)                      AS total_impressions,
  AVG(position)                         AS avg_position,
  -- List of pages as array for inspection
  ARRAY_AGG(
    STRUCT(page, clicks, position)
    ORDER BY clicks DESC
    LIMIT 5
  ) AS top_pages
FROM project.seo_data.gsc_searchanalytics
WHERE date BETWEEN DATE_SUB(CURRENT_DATE(), INTERVAL 90 DAY) AND CURRENT_DATE()
  AND site = 'sc-domain:example.com'
  AND branded = FALSE
  AND query_word_count >= 2
GROUP BY query
HAVING page_count >= 3
  AND total_clicks >= 10
ORDER BY total_clicks DESC;
Pattern 3: CTR anomaly detection against position benchmarks. A page at position 3 for a non-branded query should get roughly 8–12% CTR. Pages significantly below benchmark are either title/description problems or SERP feature suppressions. This uses a hardcoded benchmark curve — crude but fast.
-- Pattern 3: CTR underperformers vs. position benchmark
WITH benchmarks AS (
  SELECT pos, expected_ctr FROM UNNEST([
    STRUCT(1 AS pos, 0.287 AS expected_ctr),
    STRUCT(2, 0.159), STRUCT(3, 0.109), STRUCT(4, 0.078),
    STRUCT(5, 0.059), STRUCT(6, 0.046), STRUCT(7, 0.037),
    STRUCT(8, 0.031), STRUCT(9, 0.026), STRUCT(10, 0.021)
  ])
),
page_stats AS (
  SELECT
    page,
    query,
    ROUND(AVG(position)) AS avg_pos_rounded,
    SAFE_DIVIDE(SUM(clicks), SUM(impressions)) AS actual_ctr,
    SUM(impressions) AS impressions
  FROM project.seo_data.gsc_searchanalytics
  WHERE date BETWEEN DATE_SUB(CURRENT_DATE(), INTERVAL 60 DAY) AND CURRENT_DATE()
    AND site = 'sc-domain:example.com'
    AND branded = FALSE
  GROUP BY page, query
  HAVING impressions >= 100 AND avg_pos_rounded BETWEEN 1 AND 10
)
SELECT
  p.page,
  p.query,
  p.avg_pos_rounded AS position,
  b.expected_ctr,
  p.actual_ctr,
  ROUND((p.actual_ctr - b.expected_ctr) / b.expected_ctr * 100, 1) AS ctr_delta_pct,
  p.impressions
FROM page_stats p
JOIN benchmarks b ON p.avg_pos_rounded = b.pos
WHERE p.actual_ctr < b.expected_ctr * 0.6  -- more than 40% below benchmark
ORDER BY p.impressions DESC;
Patterns 4–6: Content and URL Analysis
Pattern 4: Content decay detection. Comparing two 30-day windows to find pages losing traffic — my go-to for prioritizing refresh candidates.
-- Pattern 4: Content decay — pages losing clicks period over period
WITH period_a AS (
  SELECT page, SUM(clicks) AS clicks_now, SUM(impressions) AS imp_now, AVG(position) AS pos_now
  FROM project.seo_data.gsc_searchanalytics
  WHERE date BETWEEN DATE_SUB(CURRENT_DATE(), INTERVAL 30 DAY) AND CURRENT_DATE()
    AND site = 'sc-domain:example.com'
  GROUP BY page
),
period_b AS (
  SELECT page, SUM(clicks) AS clicks_prev, SUM(impressions) AS imp_prev, AVG(position) AS pos_prev
  FROM project.seo_data.gsc_searchanalytics
  WHERE date BETWEEN DATE_SUB(CURRENT_DATE(), INTERVAL 60 DAY) AND DATE_SUB(CURRENT_DATE(), INTERVAL 31 DAY)
    AND site = 'sc-domain:example.com'
  GROUP BY page
)
SELECT
  a.page,
  a.clicks_now,
  b.clicks_prev,
  a.clicks_now - b.clicks_prev          AS click_delta,
  SAFE_DIVIDE(a.clicks_now - b.clicks_prev, b.clicks_prev) * 100 AS pct_change,
  a.pos_now,
  b.pos_prev,
  a.pos_now - b.pos_prev                AS position_change
FROM period_a a
JOIN period_b b USING (page)
WHERE b.clicks_prev >= 50   -- exclude pages with negligible baseline
  AND a.clicks_now < b.clicks_prev * 0.75  -- more than 25% drop
ORDER BY click_delta ASC
LIMIT 200;
Pattern 5: Long-tail query clustering by shared n-grams. Groups queries into clusters based on shared 2-grams. Rougher than embedding-based clustering but free and fast in pure SQL.
-- Pattern 5: 2-gram extraction for query clustering seed
-- Use this as input to Python clustering, not as the final cluster output
WITH queries AS (
  SELECT DISTINCT query, SUM(clicks) AS clicks
  FROM project.seo_data.gsc_searchanalytics
  WHERE date >= DATE_SUB(CURRENT_DATE(), INTERVAL 90 DAY)
    AND site = 'sc-domain:example.com'
    AND query_word_count >= 3
    AND branded = FALSE
  GROUP BY query
  HAVING clicks >= 3
),
words AS (
  SELECT query, clicks, word, offset
  FROM queries,
  UNNEST(SPLIT(LOWER(REGEXP_REPLACE(query, r'[^a-z0-9 ]', '')), ' ')) AS word
  WITH OFFSET AS offset
),
bigrams AS (
  SELECT
    w1.query,
    w1.clicks,
    CONCAT(w1.word, ' ', w2.word) AS bigram
  FROM words w1
  JOIN words w2
    ON w1.query = w2.query AND w2.offset = w1.offset + 1
)
SELECT
  bigram,
  COUNT(DISTINCT query) AS query_count,
  SUM(clicks)           AS total_clicks,
  ARRAY_AGG(query ORDER BY clicks DESC LIMIT 10) AS sample_queries
FROM bigrams
WHERE LENGTH(bigram) >= 5
GROUP BY bigram
HAVING query_count >= 5
ORDER BY total_clicks DESC
LIMIT 200;
Pattern 6: URL parameter pollution detection. Finds URL variants that appear in GSC data — which means Google is seeing them — and shouldn't be. Compare against a reference list of clean URL patterns.
-- Pattern 6: Detect parameterised URL variants reaching GSC
SELECT
  page,
  SUM(impressions) AS impressions,
  SUM(clicks)      AS clicks
FROM project.seo_data.gsc_searchanalytics
WHERE date >= DATE_SUB(CURRENT_DATE(), INTERVAL 30 DAY)
  AND site = 'sc-domain:example.com'
  AND REGEXP_CONTAINS(page, r'\?(.*&){2,}')  -- 3+ query parameters
  AND NOT REGEXP_CONTAINS(page, r'[?&](q|s|search)=')  -- exclude legitimate search
GROUP BY page
HAVING impressions >= 5
ORDER BY impressions DESC;
Patterns 7–9: Cross-Source Joins
These are the patterns that justify having BigQuery at all. Single-source GSC analysis you can do in Looker Studio. Cross-source joins you cannot.
Pattern 7: GSC + Log join — crawled but not clicked. URLs that Googlebot crawled frequently but that have never received a single organic click in the matching period. These are crawl budget candidates.
-- Pattern 7: High crawl frequency, zero organic clicks
-- Requires log rollup table: project.seo_data.log_url_daily
-- Schema: date DATE, url STRING, bot_type STRING, status_code INT64, request_count INT64
WITH crawl AS (
  SELECT
    url,
    SUM(request_count) AS total_crawl_requests
  FROM project.seo_data.log_url_daily
  WHERE date >= DATE_SUB(CURRENT_DATE(), INTERVAL 30 DAY)
    AND bot_type = 'googlebot'
    AND status_code = 200
  GROUP BY url
  HAVING total_crawl_requests >= 10
),
gsc AS (
  SELECT
    page,
    SUM(clicks) AS total_clicks,
    SUM(impressions) AS total_impressions
  FROM project.seo_data.gsc_searchanalytics
  WHERE date >= DATE_SUB(CURRENT_DATE(), INTERVAL 30 DAY)
    AND site = 'sc-domain:example.com'
  GROUP BY page
)
SELECT
  c.url,
  c.total_crawl_requests,
  COALESCE(g.total_clicks, 0)      AS gsc_clicks,
  COALESCE(g.total_impressions, 0) AS gsc_impressions
FROM crawl c
LEFT JOIN gsc g ON c.url = g.page
WHERE COALESCE(g.total_clicks, 0) = 0
  AND COALESCE(g.total_impressions, 0) < 5
ORDER BY c.total_crawl_requests DESC
LIMIT 500;
Pattern 8: GA4 + GSC join — organic sessions matching high-impression queries. This join is notoriously fragile because GA4 page paths and GSC page URLs are formatted differently. Normalization is the hard part. See the GA4 + BigQuery schema article for the full normalization logic — I won't duplicate it here.
-- Pattern 8: GSC impressions vs. GA4 organic sessions by landing page
-- Note: url_normalize() is a dbt macro — see companion article for SQL equivalent
WITH gsc_agg AS (
  SELECT
    page                         AS gsc_page,
    REGEXP_REPLACE(REGEXP_REPLACE(page, r'^https?://[^/]+', ''), r'[?#].*$', '') AS path_normalized,
    SUM(clicks)                  AS gsc_clicks,
    SUM(impressions)             AS gsc_impressions,
    AVG(position)                AS avg_position
  FROM project.seo_data.gsc_searchanalytics
  WHERE date BETWEEN DATE_SUB(CURRENT_DATE(), INTERVAL 30 DAY) AND CURRENT_DATE()
    AND site = 'sc-domain:example.com'
  GROUP BY gsc_page, path_normalized
),
ga4_organic AS (
  SELECT
    REGEXP_REPLACE(
      REGEXP_EXTRACT(
        (SELECT value.string_value FROM UNNEST(event_params) WHERE key = 'page_location' LIMIT 1),
        r'https?://[^/]+(/.*)$'
      ), r'[?#].*$', '') AS path_normalized,
    COUNT(DISTINCT user_pseudo_id)           AS organic_users,
    COUNTIF(event_name = 'session_start')    AS organic_sessions
  FROM project.analytics_XXXXXXX.events_*
  WHERE _TABLE_SUFFIX BETWEEN
      FORMAT_DATE('%Y%m%d', DATE_SUB(CURRENT_DATE(), INTERVAL 30 DAY)) AND
      FORMAT_DATE('%Y%m%d', CURRENT_DATE())
    AND traffic_source.medium = 'organic'
  GROUP BY path_normalized
)
SELECT
  g.path_normalized,
  g.gsc_clicks,
  g.gsc_impressions,
  g.avg_position,
  COALESCE(a.organic_sessions, 0) AS ga4_organic_sessions,
  COALESCE(a.organic_users, 0)    AS ga4_organic_users,
  -- CTR from GSC clicks to actual GA4 sessions — often < 1 due to bot filtering
  SAFE_DIVIDE(COALESCE(a.organic_sessions, 0), g.gsc_clicks) AS session_to_click_ratio
FROM gsc_agg g
LEFT JOIN ga4_organic a USING (path_normalized)
WHERE g.gsc_clicks >= 20
ORDER BY g.gsc_clicks DESC
LIMIT 300;
Pattern 9: Crawl error correlation with ranking drops. Joins log 404/5xx events with GSC position changes to find cases where crawl errors preceded ranking drops by 7–21 days.
-- Pattern 9: Crawl errors preceding ranking drops
WITH errors AS (
  SELECT
    url,
    MIN(date) AS first_error_date,
    SUM(request_count) AS error_count
  FROM project.seo_data.log_url_daily
  WHERE date BETWEEN DATE_SUB(CURRENT_DATE(), INTERVAL 90 DAY) AND DATE_SUB(CURRENT_DATE(), INTERVAL 21 DAY)
    AND bot_type = 'googlebot'
    AND status_code IN (404, 500, 503)
  GROUP BY url
  HAVING error_count >= 3
),
position_before AS (
  SELECT page, AVG(position) AS pos_before
  FROM project.seo_data.gsc_searchanalytics
  WHERE date BETWEEN DATE_SUB(CURRENT_DATE(), INTERVAL 90 DAY) AND DATE_SUB(CURRENT_DATE(), INTERVAL 60 DAY)
    AND site = 'sc-domain:example.com'
  GROUP BY page
  HAVING COUNT(*) >= 7
),
position_after AS (
  SELECT page, AVG(position) AS pos_after
  FROM project.seo_data.gsc_searchanalytics
  WHERE date BETWEEN DATE_SUB(CURRENT_DATE(), INTERVAL 21 DAY) AND CURRENT_DATE()
    AND site = 'sc-domain:example.com'
  GROUP BY page
  HAVING COUNT(*) >= 7
)
SELECT
  e.url,
  e.first_error_date,
  e.error_count,
  b.pos_before,
  a.pos_after,
  ROUND(a.pos_after - b.pos_before, 1) AS position_change
FROM errors e
JOIN position_before b ON e.url = b.page
JOIN position_after a ON e.url = a.page
WHERE a.pos_after > b.pos_before + 3  -- dropped more than 3 positions
ORDER BY position_change DESC
LIMIT 100;
Patterns 10–12: Trend and Anomaly Detection
Pattern 10: 7-day rolling averages for smoothing Google flux. Daily GSC data is noisy. Rolling averages are basic but necessary.
-- Pattern 10: 7-day rolling average clicks by page
SELECT
  date,
  page,
  clicks,
  AVG(clicks) OVER (
    PARTITION BY page
    ORDER BY date
    ROWS BETWEEN 6 PRECEDING AND CURRENT ROW
  ) AS clicks_7d_avg
FROM project.seo_data.gsc_searchanalytics
WHERE date >= DATE_SUB(CURRENT_DATE(), INTERVAL 90 DAY)
  AND site = 'sc-domain:example.com'
  AND page IN (
    -- scope to top 20 pages to keep result manageable
    SELECT page FROM project.seo_data.gsc_searchanalytics
    WHERE date >= DATE_SUB(CURRENT_DATE(), INTERVAL 30 DAY)
      AND site = 'sc-domain:example.com'
    GROUP BY page ORDER BY SUM(clicks) DESC LIMIT 20
  )
ORDER BY page, date;
Pattern 11: Z-score anomaly detection on daily clicks. Flags pages whose yesterday's click count is more than 2.5 standard deviations from their 30-day mean. Good for automated Slack alerting.
-- Pattern 11: Z-score anomaly detection on daily clicks
WITH stats AS (
  SELECT
    page,
    AVG(clicks)                 AS mean_clicks,
    STDDEV_POP(clicks)          AS stddev_clicks
  FROM project.seo_data.gsc_searchanalytics
  WHERE date BETWEEN DATE_SUB(CURRENT_DATE(), INTERVAL 31 DAY) AND DATE_SUB(CURRENT_DATE(), INTERVAL 2 DAY)
    AND site = 'sc-domain:example.com'
  GROUP BY page
  HAVING COUNT(*) >= 20 AND AVG(clicks) >= 5
),
yesterday AS (
  SELECT page, SUM(clicks) AS clicks_yesterday
  FROM project.seo_data.gsc_searchanalytics
  WHERE date = DATE_SUB(CURRENT_DATE(), INTERVAL 1 DAY)
    AND site = 'sc-domain:example.com'
  GROUP BY page
)
SELECT
  y.page,
  y.clicks_yesterday,
  s.mean_clicks,
  s.stddev_clicks,
  SAFE_DIVIDE(y.clicks_yesterday - s.mean_clicks, s.stddev_clicks) AS z_score
FROM yesterday y
JOIN stats s USING (page)
WHERE ABS(SAFE_DIVIDE(y.clicks_yesterday - s.mean_clicks, s.stddev_clicks)) >= 2.5
ORDER BY ABS(SAFE_DIVIDE(y.clicks_yesterday - s.mean_clicks, s.stddev_clicks)) DESC;
Pattern 12: Site-wide impression share by device over time. Tracks whether mobile share of impressions is shifting — an early signal of mobile UX or indexing problems.
-- Pattern 12: Device impression share trend, weekly
SELECT
  DATE_TRUNC(date, WEEK)        AS week,
  device,
  SUM(impressions)              AS impressions,
  SUM(clicks)                   AS clicks,
  SAFE_DIVIDE(SUM(impressions), SUM(SUM(impressions)) OVER (PARTITION BY DATE_TRUNC(date, WEEK))) AS impression_share
FROM project.seo_data.gsc_searchanalytics
WHERE date >= DATE_SUB(CURRENT_DATE(), INTERVAL 180 DAY)
  AND site = 'sc-domain:example.com'
GROUP BY week, device
ORDER BY week DESC, impression_share DESC;
Two Positions I Hold That Most BigQuery SEO Guides Don't
1. Scheduled queries are the wrong tool for SEO pipelines. BigQuery's built-in scheduled queries are convenient but they run as the user's identity, have no retry logic beyond "fail silently," no alerting by default, and no concept of dependency ordering. If your GSC export lands late, your scheduled query runs anyway and produces an incomplete result that looks complete. Use Airflow 3.x or even Cloud Scheduler with Cloud Functions if you want actual pipeline behavior. The scheduled query feature is fine for reports that don't matter much. Don't build critical SEO monitoring on it.
2. Clustering on more than three columns is usually counterproductive. BigQuery supports up to four clustering columns. Many guides say "cluster on everything you filter on." But clustering effectiveness degrades sharply with column count — the third and fourth columns only help when the query also filters on the first and second. In practice, for GSC data, clustering on (site, page, query) covers 90% of patterns. Adding a fourth column like device provides minimal benefit and slightly increases write costs. Benchmark before adding columns.
The Query That Cost $847 in Eleven Minutes
March 7, 2026. I was building the crawl error correlation pattern (Pattern 9 above) and made a JOIN without a partition filter on both sides. The GA4 events table for the client had 3.2 TB of data. The LEFT JOIN triggered a full scan on both tables before the WHERE clause reduced the result set. BigQuery's query planner didn't optimize the partition filter through the join predicate the way I expected.
$847.31 in billing, realized in eleven minutes of query execution. The job was still running when I noticed the bytes processed estimate in the UI — 135 TB (cross join with shuffling). I cancelled it. The partial scan still billed.
Two things I now do religiously: check the query validator's bytes estimate before running any cross-table query involving GA4 data, and set a project-level custom cost control at $50/query maximum. You set this via:
-- Set per-query byte limit at the connection level (BigQuery API)
-- In the BigQuery console: More → Query Settings → Maximum bytes billed
-- Via bq CLI:
-- bq query --maximum_bytes_billed=53687091200 'SELECT ...'
-- That's 50 GB in bytes — adjust to your comfort level
The --maximum_bytes_billed flag makes the query fail immediately rather than complete if estimated bytes exceed the limit. It's not a cost cap — it's an abort trigger. Use it.
What I Don't Use BigQuery For
Real-time alerting. BigQuery is batch; minimum query latency is several seconds, often 5–15 seconds for cached results and 20–60 seconds for cold queries. If you want to know the moment Googlebot starts returning 5xx errors on your homepage, you want a streaming log system with alerting. That's the OpenSearch layer — see the ELK pipeline article.
Keyword research data storage at scale. Storing 50 million keyword rows with search volumes in BigQuery is expensive to query repeatedly unless you're very careful about partitioning, and keyword data doesn't have a natural date partition anyway. For keyword data I use PostgreSQL with pg_trgm for fast fuzzy matching. BigQuery is the wrong tool.
Interactive exploration with fast iteration. When I'm exploring a new dataset and running 30 queries in an hour trying to understand its shape, I use DuckDB locally on a sample. Running 30 exploratory queries against a 500 GB BigQuery table costs real money and time. Sample first, BigQuery second.
Related reading: BigQuery + GSC Data Analysis (fundamentals) · SEO Log Analysis with ELK in 2026 · GA4 + BigQuery Schema Changes in 2026 · SEO Data Warehouse with dbt 1.10
External references: BigQuery pricing — Google Cloud · BigQuery cost optimization best practices — Google Cloud
These 12 patterns are running in production against real client data as of May 2026. Most of them I wrote in 2024 and have only changed the partition logic and the BigQuery output plugin syntax since. Good SQL ages better than people expect. If you spot a more efficient way to write any of them, I'm genuinely interested — the BigQuery query planner keeps getting smarter and some of these may have cheaper alternatives now.