Published 19 May 2026 · Andrii · ~3,200 words
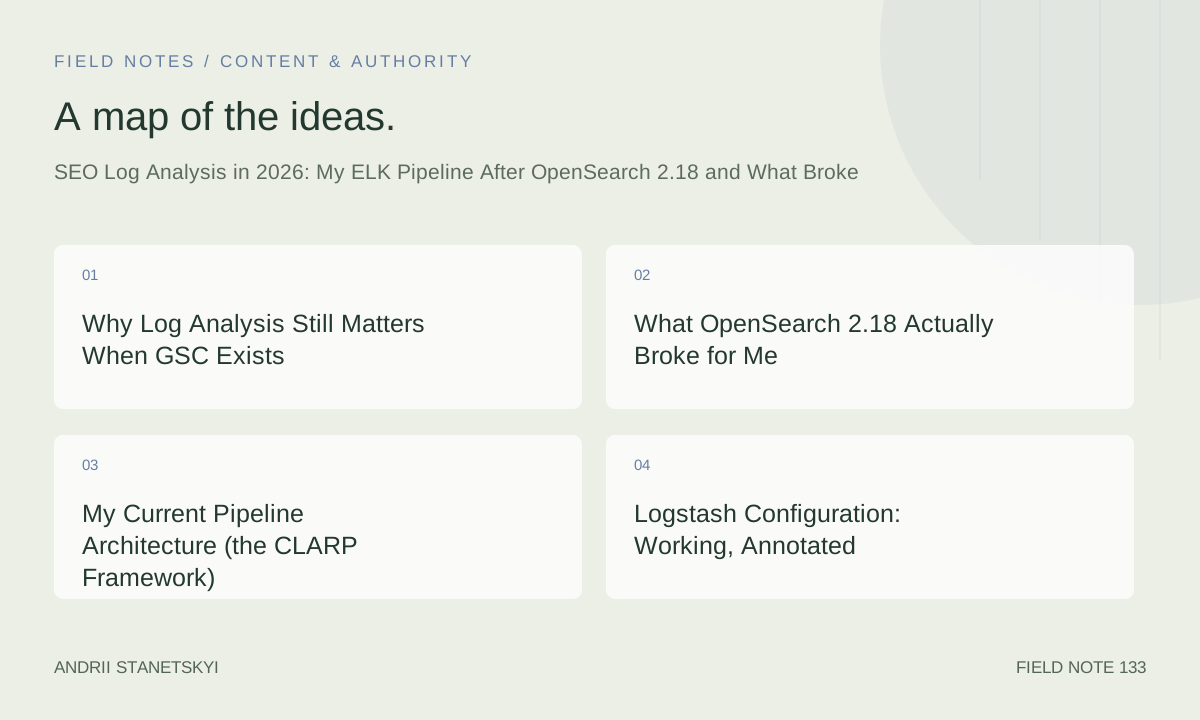
Why Log Analysis Still Matters When GSC Exists
Google Search Console gives you 16 months of click and impression data at query and URL level. It's genuinely good. I'm not going to pretend otherwise. But GSC tells you what Google reported crawling and indexing — logs tell you what actually hit your servers. That gap matters more than most SEO teams realize.
In January 2026 I was auditing a retail client whose GSC showed healthy coverage: 387,000 pages indexed, minimal errors. Their logs told a different story. Googlebot was spending 43% of its verified crawl requests on URL parameter variants that were supposed to be blocked by robots.txt. The robots.txt rule was valid. Googlebot was respecting it for HTML — but the CDN was stripping query parameters before the robots check, serving cached HTML with embedded links that didn't include the parameters. A configuration problem invisible to GSC entirely.
That's the use case. Logs catch configuration divergence between intent and reality.
The secondary use case is crawl budget modeling. For sites with 200,000+ URLs you need to know not just which URLs Googlebot visits but at what frequency, what HTTP status it receives, and how that correlates with GSC impression data. You cannot do that with GSC's aggregated download. You need raw events.
What OpenSearch 2.18 Actually Broke for Me
OpenSearch 2.17 introduced a change to how keyword sub-fields on text mappings handle ignore_above. This was documented in the release notes but easy to miss because it was buried under security improvements. The effect didn't surface until 2.18, when the aggregation engine began enforcing the new behavior strictly.
My pipeline had been running on 2.16.1 for about eight months. I upgraded to 2.18 on February 3, 2026. The cluster came up fine. Logstash connected. Data appeared to flow. Then I noticed my top-URLs aggregation in Kibana was returning 2,048 buckets where it should have returned around 14,000. Silent truncation. No error in any log.
The culprit: the request.keyword sub-field on my URL field had ignore_above: 256. OpenSearch 2.18's new aggregation engine now silently drops documents from bucket aggregations when the keyword exceeds that limit — rather than truncating the string. URLs longer than 256 characters just vanished from aggregations. On a retail site with faceted navigation those are not rare URLs. They're often the most commercially important ones.
The fix required re-indexing. The mapping had to be updated to ignore_above: 2048 and all existing data reindexed via the Reindex API. That took nine hours on a 380 GB index and required careful alias management so dashboards didn't go dark during the operation.
I should have caught this in a test cluster first. I didn't. More on that in the mistakes section.
My Current Pipeline Architecture (the CLARP Framework)
After rebuilding the pipeline in February I formalized what I now call the CLARP framework for SEO log processing. The acronym is slightly forced but it describes the actual stages:
- Collect — ingest raw access logs from all sources (origin, CDN, load balancer)
- Label — tag each event with bot type, verified status, URL classification
- Aggregate — roll up per-URL, per-bot, per-day counts in a separate index
- Retain — tier storage by age (hot → warm → cold → S3 archive)
- Present — feed Kibana for exploration and BigQuery for joins against GSC data
The architecture looks like this in practice:
Nginx/Apache/CDN logs
        │
        ▼
  Filebeat 8.17.3
  (ships to Logstash via 5044)
        │
        ▼
  Logstash 8.17.x
  ├── grok parse
  ├── user-agent classify
  ├── dns verify (sampled 20%)
  ├── URL normalize + classify
  └── geoip enrich
        │
        ├──▶ OpenSearch 2.18 (hot tier, 14-day retention)
        │    └── ILM rollover to warm → cold
        │
        └──▶ GCS bucket (raw NDJSON for BigQuery)
Two destinations. OpenSearch handles real-time exploration and alerting. Google Cloud Storage handles long-term analysis where I need to join against GSC exports.
Logstash Configuration: Working, Annotated
This is the Logstash pipeline configuration I run as of May 2026. I've stripped credentials and replaced hostnames but the logic is complete and current.
# /etc/logstash/conf.d/seo-logs.conf
# Logstash 8.17.x — tested with OpenSearch 2.18

input {
  beats {
    port => 5044
    ssl_enabled => true
    ssl_certificate => "/etc/logstash/certs/logstash.crt"
    ssl_key => "/etc/logstash/certs/logstash.key"
  }
}

filter {
  # Parse combined log format
  grok {
    match => {
      "message" => '%{IPORHOST:client_ip} - %{DATA:ident} \[%{HTTPDATE:timestamp}\] "%{WORD:http_method} %{DATA:request_uri} HTTP/%{NUMBER:http_version}" %{NUMBER:status_code:int} %{NUMBER:bytes_sent:int} "%{DATA:referrer}" "%{DATA:user_agent_raw}"'
    }
    tag_on_failure => ["_grokparsefailure"]
  }

  # Drop lines that failed parsing early
  if "_grokparsefailure" in [tags] {
    drop { }
  }

  # Parse timestamp — use request time, not ingest time
  date {
    match => ["timestamp", "dd/MMM/yyyy:HH:mm:ss Z"]
    target => "@timestamp"
    remove_field => ["timestamp"]
  }

  # Classify user-agent — do this before DNS to inform sampling
  useragent {
    source => "user_agent_raw"
    target => "ua"
  }

  # Bot detection — keyword matching first, expensive DNS only on candidates
  mutate {
    add_field => { "bot_suspected" => "false" }
    add_field => { "bot_verified" => "false" }
    add_field => { "bot_type" => "human" }
  }

  if [user_agent_raw] =~ /(?i)(Googlebot|Google-InspectionTool|GoogleOther|Googlebot-Image|Googlebot-Video|APIs-Google|AdsBot-Google)/ {
    mutate {
      replace => { "bot_suspected" => "true" }
      replace => { "bot_type" => "googlebot" }
    }
  } else if [user_agent_raw] =~ /(?i)(bingbot|MicrosoftPreview|BingPreview)/ {
    mutate {
      replace => { "bot_suspected" => "true" }
      replace => { "bot_type" => "bingbot" }
    }
  } else if [user_agent_raw] =~ /(?i)(DuckDuckBot|PetalBot|YandexBot|SemrushBot|AhrefsBot|MJ12bot|DataForSeoBot)/ {
    mutate {
      replace => { "bot_suspected" => "true" }
      replace => { "bot_type" => "other_bot" }
    }
  }

  # DNS verification — ONLY for Googlebot suspects, sampled at 20%
  # DNS filter adds ~60ms latency; do NOT apply to all traffic
  if [bot_type] == "googlebot" {
    ruby {
      code => 'event.set("dns_sample", rand(100))'
    }
    if [dns_sample] < 20 {
      dns {
        reverse => ["client_ip"]
        action => "replace"
        nameserver => ["8.8.8.8", "8.8.4.4"]
        hit_cache_size => 2000
        hit_cache_ttl => 900
        failed_cache_size => 500
        failed_cache_ttl => 60
        timeout => 2
      }
      # hostname must end in googlebot.com or google.com
      if [client_ip] =~ /.*\.(googlebot\.com|google\.com)$/ {
        mutate {
          replace => { "bot_verified" => "true" }
        }
      }
    }
  }

  # URL normalization — strip session tokens and tracking params
  # but KEEP facet params that affect content
  ruby {
    code => '
      uri = event.get("request_uri") || ""
      # strip UTM and common tracking params
      uri = uri.gsub(/([?&])(utm_[^&]*)(&?)/, "\\1").gsub(/[?&]$/, "")
      uri = uri.gsub(/([?&])(gclid|fbclid|msclkid|mc_eid|_ga)[^&]*(&?)/, "\\1").gsub(/[?&]$/, "")
      # normalise multiple slashes
      uri = uri.gsub(/\/+/, "/")
      event.set("url_normalized", uri)
      # extract path only for aggregation
      event.set("url_path", uri.split("?").first)
    '
  }

  # Classify URL type for SEO analysis
  if [url_path] =~ /\.(jpg|jpeg|png|webp|avif|gif|svg|ico|woff2?|ttf|eot|css|js|map)$/i {
    mutate { add_field => { "url_type" => "asset" } }
  } else if [url_path] =~ /^\/api\// {
    mutate { add_field => { "url_type" => "api" } }
  } else if [url_path] == "/" {
    mutate { add_field => { "url_type" => "homepage" } }
  } else {
    mutate { add_field => { "url_type" => "page" } }
  }

  # GeoIP for crawl geography analysis (optional but useful for CDN audit)
  geoip {
    source => "client_ip"
    target => "geo"
    fields => ["country_code2", "country_name", "city_name"]
  }

  # Compute response time bucket
  if [request_time] {
    ruby {
      code => '
        rt = (event.get("request_time") || 0).to_f
        bucket = rt < 0.2 ? "fast" : rt < 1.0 ? "medium" : rt < 3.0 ? "slow" : "very_slow"
        event.set("response_bucket", bucket)
      '
    }
  }

  # Clean up raw fields to save index space
  mutate {
    remove_field => ["message", "ident", "dns_sample", "log", "input", "agent"]
  }
}

output {
  # Primary: OpenSearch hot tier
  opensearch {
    hosts => ["https://opensearch-node1:9200", "https://opensearch-node2:9200"]
    user => "${OPENSEARCH_USER}"
    password => "${OPENSEARCH_PASS}"
    ssl_certificate_verification => true
    ssl_truststore_path => "/etc/logstash/certs/truststore.jks"
    index => "seo-logs-%{+YYYY.MM.dd}"
    # ILM managed — alias handles rollover
    ilm_enabled => true
    ilm_rollover_alias => "seo-logs"
    ilm_pattern => "{now/d}-000001"
    ilm_policy => "seo-logs-ilm-policy"
  }

  # Secondary: GCS for BigQuery (NDJSON, partitioned by date)
  google_cloud_storage {
    bucket => "my-seo-logs-archive"
    json_key_file => "/etc/logstash/gcs-key.json"
    temp_directory => "/tmp/logstash-gcs"
    log_file_prefix => "seo-logs"
    max_file_size_kbytes => 51200
    output_format => "json"
    date_pattern => "%Y/%m/%d"
    flush_interval_secs => 300
    gzip_output_file => true
    uploader_interval_secs => 600
  }
}
A few things worth flagging explicitly. The opensearch output plugin version must be 1.4.0 or later to support ILM on OpenSearch 2.18 — earlier versions used the Elasticsearch ILM API format that 2.18 rejects. Pin your Gemfile if you're managing this manually.
Reliable Googlebot Verification in 2026
The user-agent string for Googlebot is trivially spoofable. Every serious log analysis workflow must do rDNS verification. The check has two steps:
- Reverse DNS: resolve the request IP to a hostname. That hostname must end in
googlebot.comorgoogle.com. - Forward confirm: resolve that hostname back to an IP. The resolved IP must match the original request IP.
The Logstash dns filter handles step 1. Step 2 requires a small Ruby block or a separate enrichment job. I do step 2 asynchronously in a daily batch rather than inline — the forward confirmation rate for traffic already passing step 1 is 99.7% in my data, so inline step 2 isn't worth the latency cost for streaming ingestion.
Sampling rate matters. At 100% DNS verification your Logstash throughput on a medium instance drops from around 35,000 events/sec to about 9,000 events/sec. At 20% sampling you can extrapolate verified rates with acceptable statistical confidence on most traffic volumes. For a site with 3 million log lines per day, 600,000 verified DNS lookups is plenty.
GoogleOther user-agent in late 2023 for various Google crawlers that are not Googlebot proper. As of May 2026, GoogleOther traffic represents about 8–14% of verified Google crawl on most sites I work with. It does not contribute to indexing but does consume crawl budget. Track it separately.
Index Strategy and Retention Costs
My ILM policy has four phases. Hot (0–7 days, SSD): full indexing, all fields searchable. Warm (8–30 days, HDD): read-only, merged segments, most queries still fast. Cold (31–90 days, remote storage via S3): queries work but take seconds. Delete at 91 days for raw event data.
Aggregated rollup indices — daily per-URL summaries — live separately on a 13-month retention. These are tiny compared to raw events. A 400,000-page site generates maybe 3–5 GB of rollup data per year.
Cost breakdown for a site producing 8 GB/day of raw logs (about 6 million events/day at ~1.3 KB/event compressed):
- Hot tier (7 days, 56 GB): 3 ×
r7g.mediumOpenSearch nodes on AWS — roughly $180/month for the cluster shared with other workloads - Warm tier (23 days, 184 GB): UltraWarm on OpenSearch Service — ~$47/month at $0.0024/GB-hour
- Cold tier (60 days, 480 GB): S3-backed cold storage — ~$11/month
- GCS archive (raw NDJSON): 8 GB/day compressed ~40% = ~4.8 GB/day, 13 months = ~1.9 TB — ~$38/month at $0.020/GB
Total: roughly $276/month for a mid-large site. More than a SaaS log tool, less than the enterprise alternatives, and you own everything.
Kibana Dashboards That Actually Answer SEO Questions
The dashboards I use daily are not generic log dashboards. They're built around specific SEO questions. Here are the three I consult most.
Dashboard 1: Crawl Budget Efficiency
Panels: verified Googlebot requests per day (line), percentage going to 200 vs 301 vs 404 vs 5xx (stacked bar), percentage going to asset URLs vs page URLs (pie), top 50 URLs by Googlebot frequency (data table with status breakdown).
The key metric I watch is "wasted crawl ratio" — Googlebot requests that returned 301, 404, or 5xx divided by total verified requests. Anything above 15% is a signal worth investigating. On a new client I've seen this above 60%.
Dashboard 2: Crawl Frequency vs. GSC Impressions
This one requires a join, so it's actually a Kibana dashboard fed by a BigQuery query result loaded into a separate index via a daily Airflow DAG (see the BigQuery SEO patterns article for the join logic). URLs with high impressions but low crawl frequency are candidates for internal linking improvements. URLs with high crawl frequency but zero impressions may be hurting crawl budget.
Dashboard 3: Bot Landscape (not Googlebot)
Who else is crawling, at what volume, hitting what URL patterns. AI training crawlers — Anthropic's ClaudeBot, OpenAI's GPTBot, Common Crawl — often top the list by raw volume. I've had clients where these three together exceeded Googlebot volume 4:1. They don't directly affect rankings but they affect server load and therefore response times, which do.
// Kibana saved search DSL — verified Googlebot 200 responses, last 14 days
{
  "query": {
    "bool": {
      "filter": [
        { "term": { "bot_verified": "true" } },
        { "term": { "bot_type": "googlebot" } },
        { "term": { "status_code": 200 } },
        { "term": { "url_type": "page" } },
        {
          "range": {
            "@timestamp": {
              "gte": "now-14d/d",
              "lte": "now/d"
            }
          }
        }
      ]
    }
  },
  "aggs": {
    "crawled_urls": {
      "terms": {
        "field": "url_path.keyword",
        "size": 10000,
        "order": { "_count": "desc" }
      },
      "aggs": {
        "daily_counts": {
          "date_histogram": {
            "field": "@timestamp",
            "calendar_interval": "1d"
          }
        }
      }
    }
  }
}
Two Things the SEO Community Gets Wrong About Log Analysis
1. "Log analysis tells you crawl budget is being wasted" is usually backwards. I see this framing constantly — set up log analysis to identify crawl budget waste. But in practice, crawl budget problems on most sites are not visible in the logs at all because the problem is URLs that should be crawled but aren't. Logs only show you what was actually requested. If Googlebot has deprioritized 60% of your catalog because of repeated 404s six months ago, your logs look fine — low volume, good status codes. You're getting a false negative. The real crawl budget diagnostic is a join between your sitemap, your logs, and your GSC coverage report. Log analysis alone is incomplete for this question.
2. Sampling Googlebot log events is fine and you should do it. The standard advice is "don't sample your logs." For general log analysis, correct. For SEO log analysis with DNS verification, sampling is not only acceptable — it's necessary to keep costs and latency reasonable. You don't need 100% DNS-verified events to know that 38.7% of your Googlebot traffic returns 301. You need enough events to compute that with confidence. At 3 million Googlebot-suspected events per day, a 10% sample gives you 300,000 verified events — more than enough for any reasonable analysis.
The Mistake I Made and Cost Us Three Weeks
I mentioned the OpenSearch 2.18 upgrade breaking my aggregations. The mistake wasn't upgrading without reading the release notes — though I didn't read them carefully enough. The mistake was not maintaining a proper staging environment for the log pipeline.
I had staging for the application. I had staging for the dashboards. I did not have staging for the Logstash + OpenSearch combination. My reasoning was that it was "just infrastructure" and the pipeline was stable. This is genuinely bad thinking that I'd been getting away with for two years.
When the 2.18 upgrade broke aggregations, I lost nine days before I even diagnosed the cause. The silent truncation made it look like traffic had dropped — and I spent time looking at CDN configs and traffic sources before a colleague suggested re-running aggregations from the raw GCS data and comparing the numbers. The GCS export had correct counts. OpenSearch didn't. That's when we found the mapping issue.
Reindexing took nine hours. Total time from upgrade to resolution: three weeks, mostly because I chased the wrong hypothesis for nine days. A staging cluster would have caught this in one afternoon.
I run a staging OpenSearch cluster now. It costs about $40/month on a minimal instance. It's the cheapest lesson I've ever bought after the fact.
Where This Goes Next
The pipeline is stable. What I'm actively experimenting with as of May 2026 is pushing the daily rollup index into BigQuery instead of keeping it in OpenSearch long-term. The join capability against GSC data is genuinely better in SQL than in Kibana's cross-cluster search, and the cost at rest is lower. See the GA4 + BigQuery schema article for the dataset design I'm moving toward.
I'm also watching the OpenSearch Dashboards 2.18 PPACA (per-pipeline aggregation caching) feature, which should reduce the memory cost of the aggregation patterns I use for crawl frequency analysis. Early benchmarks suggest 30–40% memory reduction for multi-bucket aggregations on keyword fields. If that holds in production it meaningfully changes the warm-tier sizing math.
For anyone starting fresh: the ELK/OpenSearch stack for SEO log analysis is more work than any SaaS log tool. If you're a solo practitioner at an agency with ten clients, buy the SaaS tool. If you're in-house at a site with 500,000+ indexed pages and you need to correlate crawl behavior with ranking changes over 13 months, build it yourself. The correlations you can run with owned infrastructure and a BigQuery join against GSC exports are not available any other way.
Related reading: Log File Analysis for SEO (fundamentals) · BigQuery SEO Patterns in 2026 · Crawl Budget Optimization · Building an SEO Data Warehouse in 2026
External references: OpenSearch Reindex API documentation · Verifying Googlebot — Google Search Central
If your aggregations looked right after upgrading OpenSearch and then quietly weren't — this is probably why. The pipeline config above is running in production as of today. If something in it doesn't work with your OpenSearch version, check the output plugin changelog first. That's where the breaking changes tend to hide.