Most practitioners open Google Search Console, glance at the total clicks graph, note whether it went up or down, and move on. That is surveillance, not analysis. GSC contains a dataset that — when interrogated correctly — reveals crawl priorities, indexation failures, ranking velocity trends, cannibalization signals, and click-through rate anomalies that no third-party tool can replicate. This guide is a systematic methodology for extracting that intelligence, not a tour of the interface.
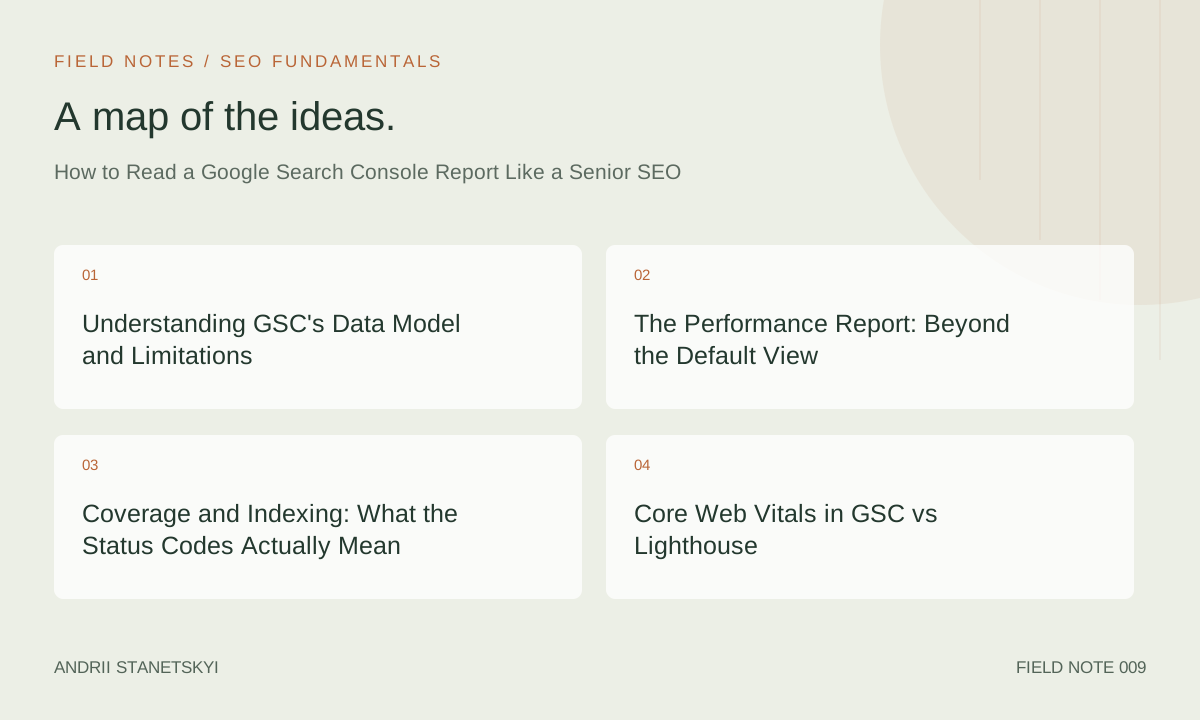
Understanding GSC's Data Model and Limitations
Before interpreting any GSC number, understand the data's constraints. Misreading GSC outputs is far more dangerous than not reading them at all — it produces confident wrong conclusions.
The 16-Month Data Window
GSC stores 16 months of performance data. This is sufficient for year-over-year comparison but not for multi-year trend analysis. Export historical data to BigQuery via the GSC API or to a spreadsheet monthly. If you inherit a site and the previous owner didn't export historical data, it is gone — there is no workaround. Set up automated exports on day one of any engagement.
Sampling, Rounding, and the 1,000-Row API Limit
The GSC UI shows sampled data for large sites. The API returns up to 25,000 rows per request but limits total rows per query to 25,000. For sites with more than 25,000 unique query-page combinations (common above 50K monthly sessions), you must paginate API calls and aggregate. Data in the UI for large date ranges is sampled — the API with shorter date ranges produces more complete data. For precise numbers on high-traffic pages, query the API with 7-day windows rather than 90-day aggregates.
The 28-Hour Data Lag
GSC data lags approximately 48–72 hours for indexing data and 24–48 hours for performance data. Do not use GSC to diagnose same-day issues. If a page was published today and you don't see it in GSC's coverage report, that is expected — not a problem. Use the URL Inspection tool for real-time crawl status on individual URLs.
Query-Level Data Is "Not Provided" for Brand Queries at Scale
GSC omits query data for queries with very low impression counts (privacy threshold) and anonymizes some branded data. The practical implication: small-volume queries — often the highest-intent long-tail terms — disappear below the reporting threshold. These are visible in aggregate (their clicks and impressions roll up into totals) but invisible at query level. Interpret the visible query count in GSC as a lower bound, not a complete picture.
The Performance Report: Beyond the Default View
The Performance report is the most data-rich section of GSC and the most commonly misread. Here is the analytical framework I use.
Setting Up the Right Comparison View
Default view (last 3 months) is useful for trend-spotting. For diagnostic work, use the Date comparison feature: compare the last 28 days to the same period 1 year ago. This controls for seasonality. A 20% traffic drop year-over-year means something. A 20% drop versus last month during a seasonal trough means nothing.
Enable all four metrics simultaneously: Total clicks, Total impressions, Average CTR, Average position. A page with rising impressions and falling clicks has a CTR problem, not a ranking problem — these require completely different interventions.
The CTR Analysis That Most Practitioners Skip
Export the Queries view sorted by Impressions (descending). Filter for queries with >100 impressions per month and average position between 1 and 10. These are your pages that are visible and ranking but failing to generate clicks. Expected CTR benchmarks by position (2025 data across commercial SERPs):
| SERP Position | Avg CTR (Informational) | Avg CTR (Commercial) | Avg CTR (Navigational) |
|---|---|---|---|
| 1 | 28–35% | 18–25% | 40–55% |
| 2 | 14–18% | 10–15% | 18–25% |
| 3 | 9–12% | 7–11% | 10–16% |
| 4–5 | 5–8% | 4–7% | 6–10% |
| 6–10 | 2–4% | 1.5–3.5% | 2–5% |
Any query where your actual CTR falls more than 30% below the benchmark for that position deserves investigation. Common causes: title tag doesn't match search intent, SERP features (AI Overview, featured snippet, image pack) are suppressing click-through, or a competitor has a substantially more compelling meta description. These are all fixable without improving rankings.
Identifying Cannibalization in GSC Data
Export the Pages tab for a target keyword cluster. If multiple URLs are appearing for the same query, filter by query and look at the Pages breakdown. Two URLs sharing impressions for the same informational query is a cannibalization signal. The diagnostic: in the Page view, filter to a specific page, then switch to the Queries tab — do any of those queries also appear prominently for a different page? Cross-reference with Ahrefs' organic keyword overlap tool to confirm. GSC doesn't label cannibalization — you have to read the pattern.
Position Trends vs Position Averages
Average position in GSC is a weighted average of position across all queries matching your filters. A site with 100 keywords at position 1 and 900 keywords at position 50 shows an "average position" of approximately 46 — which looks like poor performance but represents excellent performance. Never report average position as a standalone metric. Always segment: top-10 keyword count, top-3 keyword count, and keyword count by position range.
Device and Country Segmentation
Use the Device filter to compare mobile versus desktop CTR for your top landing pages. A CTR gap greater than 20% (mobile lower than desktop for the same queries) indicates a mobile SERP presentation problem — often caused by a title tag that truncates poorly on mobile screens (mobile truncates at approximately 50–55 characters, versus 55–60 on desktop). The Search Type filter (Web/Image/Video/News) reveals ranking surfaces you may not be tracking — image search traffic from an e-commerce site is often 15–25% of total sessions and entirely invisible if you only look at Web search data.
Coverage and Indexing: What the Status Codes Actually Mean
The Coverage report (now called "Indexing" in the updated GSC interface) is where most technical SEO diagnostics begin. The status categories are more granular than most practitioners realize.
Valid Pages: Not All Good News
A URL appearing in "Valid" status means Google has indexed it. It does not mean Google considers it high-quality, likely to rank, or aligned with your site architecture. Validate the Valid count against your intended canonical URL set. Use Screaming Frog's Crawl All URLs feature combined with the GSC API integration to compare your crawl coverage against GSC's indexed URL set. The delta — URLs Screaming Frog finds but GSC hasn't indexed — is your crawl efficiency gap.
Excluded: The Most Useful Category
The Excluded category is where diagnostic value lives. Common statuses and what they actually mean:
- Crawled — currently not indexed: Google crawled the page but decided not to index it. This is a content quality signal. It does not mean a technical error. Pages in this status are candidates for content improvement or consolidation — not for adding to your sitemap more aggressively.
- Discovered — currently not indexed: Google found the URL but has not yet crawled it. This is a crawl budget issue. Either the site's crawl budget is insufficient or the URL's internal link authority is too low to prioritize. Add internal links from high-authority pages to prioritize critical URLs.
- Alternate page with proper canonical tag: The page has a canonical pointing to another URL and Google is respecting it. This is expected behavior for paginated content, parameter URLs, and duplicate versions. Verify the canonical destination is indexed correctly.
- Page with redirect: The URL has a redirect. Check that the redirect chain is not longer than one hop and that the destination URL is indexed.
- Soft 404: Google's systems determined the page returns a 200 HTTP status but has content indicating the page doesn't exist or has no meaningful content. This is a content quality signal for thin or error-state pages that aren't returning proper 404 status codes.
Step-by-Step: Diagnosing "Crawled — Currently Not Indexed" at Scale
- Export the full Excluded list from GSC (download as CSV).
- Filter for "Crawled — currently not indexed" status.
- Import the URL list into Screaming Frog using List mode. Run a crawl with content analysis enabled.
- Check word count, title uniqueness, and duplicate content scores for each URL in the Screaming Frog output.
- Segment URLs by content length: below 300 words is almost certainly a thin content issue. Between 300–800 words, check for duplicate or near-duplicate content using Copyscape or Siteliner.
- For URLs above 800 words that remain unindexed, check internal link count (Screaming Frog's Inlinks column) — if below 3, internal link authority is likely insufficient.
- Prioritize: fix thin content issues on pages in your target keyword clusters first. Do not expend resources on URLs outside your core architecture.
Core Web Vitals in GSC vs Lighthouse
GSC's Core Web Vitals report and Lighthouse produce different data from different sources. Conflating them causes misdiagnosis.
GSC CWV: Field Data at URL Group Level
GSC's Core Web Vitals report uses Chrome User Experience Report (CrUX) field data — real user measurements collected from Chrome browsers. Data is aggregated at the URL group level (similar page templates are grouped together) and requires a minimum traffic threshold to appear. A page with fewer than roughly 3,000 monthly sessions from Chrome users will not have CrUX data and will not appear in the GSC CWV report.
Lighthouse: Lab Data for Individual URLs
Lighthouse measures a simulated page load on a throttled connection in a controlled environment. It is useful for identifying what is causing a problem on a specific URL but does not represent real user experience. A page can score 95 in Lighthouse and fail GSC's CWV thresholds because real users on slower devices and connections experience worse performance than the lab simulation.
Use GSC Core Web Vitals to identify which URL groups have field data problems. Use Lighthouse (via Chrome DevTools or PageSpeed Insights API) to diagnose the root cause on individual representative URLs. Do not optimize for Lighthouse scores — optimize for CrUX field data. They are correlated but not identical.
Reading the CWV Status Distribution
In the GSC CWV report, each URL group shows three segments: Good, Needs Improvement, Poor. Google's threshold for "Good" is: LCP < 2.5s, INP < 200ms, CLS < 0.1. The report shows the 75th percentile of real user measurements — meaning 25% of users experience worse performance than what the report shows as your threshold value. When prioritizing CWV fixes, address URL groups with >30% of users in "Poor" status before addressing "Needs Improvement" groups.
Manual Actions and Security Issues
The Manual Actions report in GSC should be checked at every site audit and at every client onboarding. A manual action that has been unaddressed for months is a recoverable situation — one that is never discovered is not.
Manual Action Types and Immediate Response
If the Manual Actions report shows a green checkmark and "No issues detected," document this with a screenshot and date for your records — particularly during site acquisitions. If an action is present, the description provides the category. Read the category description precisely; the vague language obscures actionable specifics that are only clear when you read Google's documentation for that specific action type.
Immediate actions upon discovering a manual action: (1) document in client-facing report with screenshot, (2) audit the domain for the specific violation described, (3) do not file a reconsideration request until the violation is remediated — premature reconsideration requests burn reviewer goodwill and extend recovery time.
Security Issues: Higher Priority Than Rankings
The Security Issues report surfaces hacked content, malware, and phishing detections. These can cause Chrome Safe Browsing warnings that block users before they reach the site — a more immediate business impact than any ranking issue. A security issue that goes unaddressed will eventually trigger deindexation. When a client reports sudden traffic collapse to near-zero, check Security Issues before diagnosing algorithm changes.
Links Report: What GSC Tells You That Ahrefs Doesn't
The GSC Links report shows links Google has actually processed and associated with your domain — not the universe of links that Ahrefs' crawler has discovered. These two datasets diverge in meaningful ways.
External Links: Google's Crawled and Credited View
Ahrefs' index in 2026 covers approximately 3 trillion links — far more than Google has crawled and credited. The GSC Links report shows a subset: links Google has crawled, evaluated, and associated with your domain in its index. Links that appear in Ahrefs but not in GSC may have been crawled and discounted (no-followed, algorithmically ignored, or from deindexed domains). Comparing the two datasets identifies potentially discounted links — useful for understanding why your link profile in Ahrefs doesn't translate to expected rankings.
Internal Links: The Underused Diagnostic
GSC's Internal Links report shows which pages receive the most internal links from your site. This is your effective PageRank distribution — not your intended one. Compare the top 20 internally-linked pages in GSC against your target landing pages. If your homepage receives 5,000 internal links and your highest-priority category page receives 40, your internal link architecture has a distributional problem regardless of what your site navigation looks like.
Practical Workflows: Monthly GSC Audit Checklist
This is the exact workflow I run monthly for clients with established sites. Adapt timing for site size — larger sites need weekly checks on indexation and CWV.
Week 1: Performance Analysis
- Open Performance report. Set comparison: last 28 days vs prior 28 days. Note total click delta.
- Sort by Clicks descending. Identify top 20 pages. For each, check CTR vs position benchmark. Flag underperformers.
- Filter by queries with impressions >500 and position 1–3. Identify CTR below 15% for informational queries — title/description optimization opportunity.
- Export full query list (API, paginate if needed). Run cannibalization analysis: group queries by topic cluster, check if multiple URLs appear for same cluster queries.
- Check keyword ranking movement for 30 highest-priority target keywords. Note any position 11–20 queries (page 2 proximate) for prioritization.
Week 2: Indexing and Coverage
- Open Indexing report. Note total indexed URL count. Compare to last month's export. Large changes (>5% in either direction) require investigation.
- Export Excluded URLs. Triage by status type. "Crawled — currently not indexed" URLs for target pages require immediate attention.
- Run URL Inspection on 5 recently published strategic pages. Verify indexed, canonical correct, and structured data detected without errors.
- Check sitemap status. All submitted sitemaps should show "Success" with indexed URL count. A "Couldn't fetch" or "Has errors" status requires immediate investigation.
Week 3: Technical and UX Signals
- Review Core Web Vitals report. Any new URL groups appearing in "Poor" status? Cross-reference with recent deploys.
- Check Breadcrumbs, FAQ, and Product structured data reports for new errors or warnings. GSC flags schema markup errors before they affect rich result eligibility.
- Review Manual Actions — confirm "No issues detected" and screenshot for records.
- Check Security Issues — confirm clean. If issues present, escalate immediately.
Mini Case Study: CTR Optimization Using GSC Data
A SaaS company with 45,000 monthly clicks identified 18 informational pages ranking in positions 1–4 with CTR more than 40% below position benchmarks. GSC data showed high impression volume but low click-through. Analysis: 12 of 18 pages had AI Overviews appearing above the organic result (visible in SERP audit using Semrush's SERP features tool). The remaining 6 had generic title tags ("What is X" format) competing against pages with more specific, benefit-driven titles. Intervention: rewrote title tags for the 6 non-AI-Overview pages, testing 3 variants using a crawl-based A/B testing approach via Search Console Experiments. After 8 weeks: average CTR improvement of 22% on the tested pages. The AI Overview pages were de-prioritized — CTR improvement on those requires restructuring content to capture the Overview citation, not optimizing the organic listing below it.
FAQ
Why does my GSC data not match Google Analytics?
GSC and GA measure different things. GSC counts clicks — instances where a user clicked your URL in Google search results. GA counts sessions — visits to your site, regardless of source, including direct, referral, and social. Additionally, GSC counts all Google Search surfaces (Web, Image, Video, News, Discover) while GA by default aggregates the "google / organic" channel. Discrepancies of 10–30% between the two are normal. Consistent directional trends should align; absolute numbers will not match.
How do I find which pages lost rankings after an algorithm update?
In the Performance report, set the date comparison to the 28 days after the update versus 28 days before. Filter the Pages tab sorted by "Difference" ascending. The pages with the largest negative click delta are your ranking losers. Then filter by queries for each losing page to identify which specific queries dropped — is it the primary target keyword or a long-tail cluster? This determines whether you have an on-page relevance issue or a site-wide authority issue.
What does "Discovered — currently not indexed" at scale indicate?
At scale (hundreds of URLs), this is a crawl budget constraint signal. Google has found these URLs through internal links or sitemaps but is not prioritizing crawling them. Audit your crawl budget allocation: check your server logs to see which URLs Googlebot is spending time on (Screaming Frog Log File Analyser or Semrush Log File Analyser). If Googlebot is spending significant crawl budget on faceted navigation, parameter URLs, or pagination that shouldn't be indexed, fix that allocation first before expecting strategic content to get crawled.
Can I use GSC data to calculate the value of a ranking improvement?
Yes, and this is one of GSC's most underused applications. For a target keyword, take its GSC impression count × (expected CTR at target position − current CTR) × average session value from GA. This gives you a rough click value of a position improvement. For a keyword with 10,000 monthly impressions where you're at position 5 (4% CTR = 400 clicks) targeting position 2 (15% CTR = 1,500 clicks), the incremental value is 1,100 clicks × your average session value. Presenting this to clients converts SEO from a cost center to a quantified investment.
How often should I check GSC for a new site?
For a newly launched site: daily for the first two weeks (monitoring for indexation of key pages), weekly for months 1–6 (tracking crawl coverage expansion and first ranking appearances), monthly for ongoing established operations. Set up email alerts in GSC for Manual Actions and Security Issues — these should trigger immediate review regardless of your regular schedule.
Why is my sitemap showing fewer indexed URLs than my crawl found?
The sitemap Indexed count in GSC shows how many of the URLs in your sitemap Google has indexed — not how many total pages Google has indexed from your site. A URL can be indexed from internal links or external links without being in your sitemap. Conversely, a URL in your sitemap may not be indexed if Google's quality assessment doesn't support indexation. The gap between "Submitted" and "Indexed" in the sitemap report is normal up to approximately 15–20% for large sites; above that, investigate the excluded URLs from that sitemap for systematic content quality issues.
Is there a way to see which of my pages get Google Discover traffic?
Yes. In the Performance report, change the Search Type filter from "Web" to "Discover." This shows a completely separate traffic source — content recommendations pushed to Chrome and Google app users. Discover traffic is volatile and unrelated to keyword rankings. Pages that generate Discover traffic are typically timely, visual-forward, and have strong engagement signals. If your site receives Discover traffic, treat it as a separate channel with its own content strategy rather than trying to optimize it alongside organic search.
Key Takeaways
- GSC data is sampled for large sites and delayed by 24–72 hours — use the API with short date windows for precise data on high-traffic properties.
- Average position is a misleading aggregate metric — always segment by position range and report top-3, top-10 keyword counts instead.
- CTR gaps (actual vs benchmark by position) are the fastest ROI opportunity in GSC — fixable with title tag and meta description work, no ranking improvement required.
- "Crawled — currently not indexed" is a content quality signal, not a technical crawl error. Address it with content improvement, not sitemap manipulation.
- GSC's Internal Links report shows your actual PageRank distribution. Compare it against your intended architecture and close the gap with targeted internal linking.
- GSC and Ahrefs link counts diverge because GSC shows credited links, not crawled links. Use both together to understand link equity more completely.
- Set up automated GSC data exports from day one. The 16-month data window is finite and historical data cannot be recovered once it expires.
Conclusion
Google Search Console is the only dataset in SEO that comes directly from Google's systems. Every third-party tool — Ahrefs, Semrush, Moz — approximates what GSC measures exactly. That makes it the highest-value data source in your toolkit, and the one that rewards careful reading most. The practitioners who extract the most value from GSC are not the ones who know the interface best — they are the ones who understand the data model, recognize its limitations, and apply systematic analysis workflows rather than casual observation. Develop that discipline and GSC becomes a continuous source of diagnostic signal, not a dashboard you glance at to confirm your assumptions.