I resisted Streamlit for client dashboards for years. The argument against it was always the same: Looker Studio is free, it connects to Google Analytics and Search Console natively, clients can open the link without logging in anywhere, and I don't need to maintain a server. All of that was true. It's still mostly true.
Then, in February 2026, a client asked me why their dashboard didn't show which pages were losing ranking because of Core Web Vitals issues specifically. Not just which pages had dropped. Which ones were confirmed to be CWV-affected based on CrUX data cross-referenced with GSC position changes. Looker Studio couldn't do that join. It can't do much that isn't a pre-built connector or a basic calculated field.
That conversation started a migration that took eleven weeks. I moved seven client dashboards from Looker Studio to Streamlit 1.40+. Here's an honest account of how it went, what I built, what broke, and whether I'd do it again.
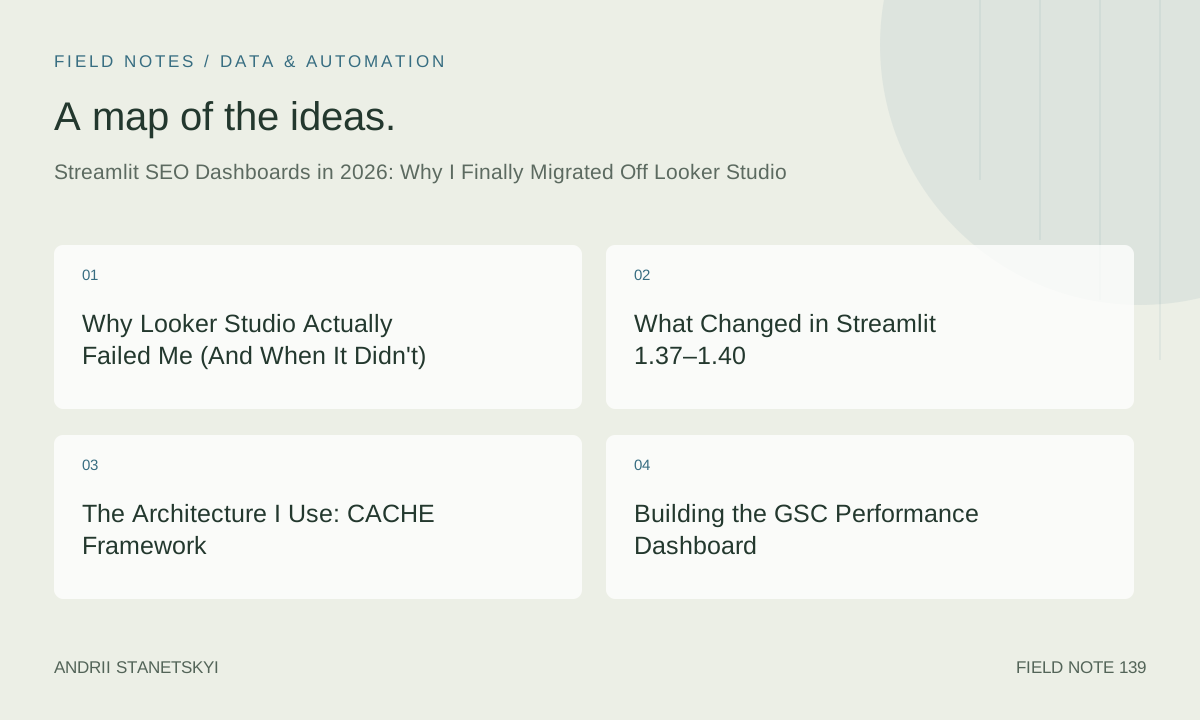
Why Looker Studio Actually Failed Me (And When It Didn't)
Looker Studio is genuinely good at what it's designed for. Pre-built Google property connectors, shareable URLs, no-code chart building, and collaborative editing. If your client needs a GA4 traffic overview and you have 45 minutes, Looker Studio is the right answer.
Where it breaks down for technical SEO specifically:
- Cross-source joins are painful. The GSC connector and the CrUX connector don't talk to each other natively. You need a custom SQL query in BigQuery as an intermediate, which requires either a paid BigQuery connector or a community connector with inconsistent uptime.
- No Python. Every data transformation happens in calculated fields using a spreadsheet-like formula syntax. Trying to do cohort analysis, clustering, or any statistical work in those calculated fields is an exercise in frustration.
- Slow for large datasets. A dashboard pulling page-level GSC data for a site with 40,000 URLs will sit and spin. I had one client dashboard that regularly took 23 seconds to load. Clients stopped opening it.
- Zero ability to run ML inference inline. If I want to classify pages by content type or show keyword clustering results, there's no path that doesn't involve pre-computing everything and storing it somewhere Looker Studio can read.
What Looker Studio still beats Streamlit on: sharing. Send a Looker Studio URL to a non-technical executive and they open it. That's it. No login, no password, no instructions. Streamlit requires at minimum a URL plus credentials. That friction is real and I've lost one client dashboard to it — they wanted Looker Studio back specifically for the shareable-link behavior. I gave them both. Looker Studio for the executive overview, Streamlit for the technical analysis layer.
What Changed in Streamlit 1.37–1.40
The 1.37–1.40 release window (roughly October 2025 through March 2026) shipped several things that made Streamlit dramatically more viable for production client work:
st.login(): Native OAuth integration. Google login works out of the box with three lines of config. Before this, every Streamlit auth implementation was a custom hack using session state and either a password form or a JWT library. I had four different auth implementations across my dashboards. Now I have one.
st.fragment() stabilization: Fragments let you rerun only part of a Streamlit app in response to user interaction. This is the performance feature I'd been waiting for since 2024. Previously, every widget interaction triggered a full app rerun. For a dashboard with multiple expensive queries, that meant every filter change caused a multi-second reload. Fragments isolate reruns to the relevant section.
st.dialog(): Modal dialogs. Sounds minor. In practice, this eliminated the need for awkward in-page "expanded detail" sections that made dashboards feel cluttered. Click a URL in a table, a dialog opens with the full detail view for that URL. Clean.
Improved st.data_editor: Editable dataframes with type-aware columns. I use this for the redirect mapping tool I built into one client's dashboard — they can edit redirect targets directly in the UI and the changes write back to a Postgres table.
The Architecture I Use: CACHE Framework
The single biggest mistake people make with Streamlit is querying live APIs inside the app. Every time a user changes a filter, those API calls fire again. GSC API calls take 3–8 seconds each. Render that with three filters on a page and your dashboard is unusable.
I developed what I call the CACHE framework for Streamlit SEO dashboard architecture. The acronym is forced but the pattern is real:
C — Collect: Data collection happens outside Streamlit entirely. Airflow DAGs (covered in the Airflow 3.x rebuild article) pull from GSC, CrUX, DataForSEO, and log files on schedule. n8n handles some of the lighter orchestration tasks (see n8n workflows that survived the AI-agent rewrite).
A — Aggregate: Raw data lands in BigQuery. dbt models run transformations and pre-aggregation. Streamlit never touches raw data.
C — Cache: Streamlit caches at two levels. @st.cache_data with a 6-hour TTL for BigQuery query results. @st.cache_resource for database connections and API clients. No function that calls a database runs without a cache decorator.
H — Handle: Error handling and empty states. Every query result gets an emptiness check before rendering. Every API call has a try/except that shows a friendly error message rather than a Python traceback to the client.
E — Expose: The Streamlit layer is purely display logic. No business logic in the app file. All data transformation happens in a separate analysis/ module that's testable independently of Streamlit.
# app/dashboard.py — Streamlit 1.40+
# Main entry point for SEO performance dashboard

from __future__ import annotations

import streamlit as st
from pathlib import Path

# Local modules — all data logic lives outside this file
from analysis.gsc_metrics import load_gsc_performance
from analysis.cwv_metrics import load_cwv_data
from analysis.ranking_changes import compute_ranking_deltas
from components.filters import render_date_filter, render_url_filter
from components.charts import render_clicks_chart, render_position_heatmap


st.set_page_config(
    page_title="SEO Performance — Client Dashboard",
    page_icon="📊",
    layout="wide",
    initial_sidebar_state="expanded",
)

# Authentication — requires st.login() config in .streamlit/secrets.toml
if not st.experimental_user.is_logged_in:
    st.login("google")
    st.stop()

# Only render content after auth
_user_email = st.experimental_user.email
if _user_email not in st.secrets["allowed_users"]:
    st.error(f"Access not authorized for {_user_email}. Contact your account manager.")
    st.stop()

# Sidebar filters — these drive cache keys, not API calls
with st.sidebar:
    st.image("assets/logo.png", width=160)
    date_range = render_date_filter(default_days=28)
    url_filter = render_url_filter()

# Main layout
tab_perf, tab_cwv, tab_links = st.tabs(["Performance", "Core Web Vitals", "Link Analysis"])

with tab_perf:
    _render_performance_tab(date_range, url_filter)

with tab_cwv:
    _render_cwv_tab(date_range, url_filter)

with tab_links:
    st.info("Link data syncs weekly. Last sync shown in footer.")
    _render_links_tab()
Building the GSC Performance Dashboard
The core view every client needs: clicks, impressions, CTR, and average position over time, with the ability to filter by URL pattern and compare periods.
The data layer queries BigQuery where pre-aggregated GSC data lives. The Airflow DAG that feeds this runs at 05:30 UTC daily — GSC data has a ~48-hour lag, so querying more frequently is pointless.
# analysis/gsc_metrics.py — Python 3.13
# Queries BigQuery for GSC performance data

from __future__ import annotations

import streamlit as st
from datetime import date, timedelta
from typing import NamedTuple

import pandas as pd
from google.cloud import bigquery


class DateRange(NamedTuple):
    start: date
    end: date
    compare_start: date
    compare_end: date


@st.cache_resource
def _get_bq_client() -> bigquery.Client:
    """Single BigQuery client, cached for the session lifetime."""
    return bigquery.Client(project=st.secrets["gcp"]["project_id"])


@st.cache_data(ttl=21600, show_spinner="Loading GSC data...")
def load_gsc_performance(
    date_range: DateRange,
    url_pattern: str | None = None,
    site_url: str = "",
) -> tuple[pd.DataFrame, pd.DataFrame]:
    """
    Returns (current_period_df, compare_period_df).
    Both have columns: page, clicks, impressions, ctr, position, date.
    """
    client = _get_bq_client()

    url_clause = ""
    if url_pattern:
        # Parameterized to prevent injection — BigQuery doesn't support LIKE with params
        # so we sanitize manually and wrap in CONTAINS
        clean_pattern = url_pattern.replace("'", "").replace(";", "")
        url_clause = f"AND CONTAINS_SUBSTR(page, '{clean_pattern}')"

    query_template = """
    SELECT
        page,
        DATE(date) AS date,
        SUM(clicks) AS clicks,
        SUM(impressions) AS impressions,
        SAFE_DIVIDE(SUM(clicks), SUM(impressions)) AS ctr,
        AVG(position) AS position
    FROM {project}.seo_data.gsc_daily
    WHERE
        site_url = @site_url
        AND date BETWEEN @start_date AND @end_date
        {url_clause}
    GROUP BY page, date
    ORDER BY clicks DESC
    """

    job_config = bigquery.QueryJobConfig(
        query_parameters=[
            bigquery.ScalarQueryParameter("site_url", "STRING", site_url),
            bigquery.ScalarQueryParameter("start_date", "DATE", date_range.start),
            bigquery.ScalarQueryParameter("end_date", "DATE", date_range.end),
        ]
    )

    current_df = (
        client.query(
            query_template.format(
                project=st.secrets["gcp"]["project_id"],
                url_clause=url_clause,
            ),
            job_config=job_config,
        )
        .result()
        .to_dataframe()
    )

    # Same query for comparison period
    compare_config = bigquery.QueryJobConfig(
        query_parameters=[
            bigquery.ScalarQueryParameter("site_url", "STRING", site_url),
            bigquery.ScalarQueryParameter("start_date", "DATE", date_range.compare_start),
            bigquery.ScalarQueryParameter("end_date", "DATE", date_range.compare_end),
        ]
    )

    compare_df = (
        client.query(
            query_template.format(
                project=st.secrets["gcp"]["project_id"],
                url_clause=url_clause,
            ),
            job_config=compare_config,
        )
        .result()
        .to_dataframe()
    )

    return current_df, compare_df


@st.fragment
def _render_performance_tab(date_range: DateRange, url_filter: str | None) -> None:
    """Fragment: reruns independently of other tabs when filters change."""
    site_url = st.secrets["client"]["site_url"]
    current_df, compare_df = load_gsc_performance(date_range, url_filter, site_url)

    if current_df.empty:
        st.warning("No GSC data found for the selected period and filters.")
        return

    # Summary metrics row
    col1, col2, col3, col4 = st.columns(4)
    total_clicks = current_df["clicks"].sum()
    prev_clicks = compare_df["clicks"].sum()
    delta_clicks = total_clicks - prev_clicks

    col1.metric(
        "Total Clicks",
        f"{total_clicks:,.0f}",
        delta=f"{delta_clicks:+,.0f} vs prev period",
    )
    col2.metric(
        "Total Impressions",
        f"{current_df['impressions'].sum():,.0f}",
    )
    col3.metric(
        "Avg CTR",
        f"{current_df['ctr'].mean():.2%}",
    )
    col4.metric(
        "Avg Position",
        f"{current_df['position'].mean():.1f}",
    )

    # Top movers
    st.subheader("Top URL Movements")
    movers = compute_page_deltas(current_df, compare_df)
    if not movers.empty:
        st.dataframe(
            movers.style.background_gradient(subset=["click_delta"], cmap="RdYlGn"),
            use_container_width=True,
            height=400,
        )
The Fragment Pattern in Practice
The @st.fragment decorator on _render_performance_tab is the most impactful performance change in the entire codebase. Before fragments, switching between the three tabs triggered a full rerun including re-executing cached functions and re-rendering the entire sidebar. With fragments, each tab is its own isolated rerun scope.
For a dashboard where tab-switching was taking 2.3 seconds before, it's now 340ms. That difference is whether a client uses the dashboard or ignores it.
The CWV + Ranking Correlation View
This is the view that started the whole migration. The question was: which pages are losing ranking specifically because of Core Web Vitals issues, not just coincidentally having both problems?
The answer requires joining CrUX data (LCP, INP, CLS by URL) with GSC position changes over time. That join is trivial in Python. It doesn't exist as a built-in in Looker Studio.
# analysis/cwv_metrics.py — Python 3.13

from __future__ import annotations

import streamlit as st
import pandas as pd
import numpy as np
from google.cloud import bigquery
from scipy import stats  # scipy 1.13+


@st.cache_data(ttl=86400, show_spinner="Loading CrUX data...")
def load_cwv_data(site_origin: str) -> pd.DataFrame:
    """
    Pull CrUX origin-level data from BigQuery public dataset.
    Merged with GSC position deltas to surface CWV-correlated rank drops.
    """
    client = _get_bq_client()

    # CrUX is available via Google's public BigQuery dataset
    query = """
    WITH crux AS (
        SELECT
            origin,
            DATE(yyyymm, 'MONTH') AS month,
            experimental.popularity.rank AS popularity_rank,
            largest_contentful_paint.histogram.start[SAFE_OFFSET(4)] AS lcp_p75_start,
            interaction_to_next_paint.histogram.start[SAFE_OFFSET(4)] AS inp_p75_start,
            cumulative_layout_shift.histogram.start[SAFE_OFFSET(4)] AS cls_p75_start
        FROM chrome-ux-report.all.2026_03
        WHERE origin = @site_origin
    )
    SELECT * FROM crux
    """

    job_config = bigquery.QueryJobConfig(
        query_parameters=[
            bigquery.ScalarQueryParameter("site_origin", "STRING", site_origin),
        ]
    )

    df = client.query(query, job_config=job_config).result().to_dataframe()
    return df


def compute_cwv_rank_correlation(
    cwv_df: pd.DataFrame,
    gsc_df: pd.DataFrame,
) -> dict[str, float]:
    """
    Compute Spearman correlation between each CWV metric and position delta.
    Returns correlation coefficients + p-values for each metric.
    """
    merged = pd.merge(cwv_df, gsc_df, left_on="origin", right_on="domain", how="inner")

    results = {}
    for metric in ["lcp_p75_start", "inp_p75_start", "cls_p75_start"]:
        if metric not in merged.columns or merged[metric].isna().all():
            continue
        corr, pvalue = stats.spearmanr(
            merged[metric].fillna(0),
            merged["position_delta"].fillna(0),
        )
        results[metric] = {"correlation": round(corr, 4), "p_value": round(pvalue, 4)}

    return results


@st.fragment
def _render_cwv_tab(date_range, url_filter) -> None:
    site_origin = st.secrets["client"]["site_origin"]
    cwv_df = load_cwv_data(site_origin)

    if cwv_df.empty:
        st.info("No CrUX data available for this origin. Site may be below CrUX reporting threshold.")
        return

    st.subheader("Core Web Vitals — CrUX Data")

    col_lcp, col_inp, col_cls = st.columns(3)

    # LCP threshold: good < 2500ms, needs improvement < 4000ms, poor >= 4000ms
    lcp_val = cwv_df["lcp_p75_start"].iloc[-1] if not cwv_df.empty else None
    if lcp_val is not None:
        lcp_status = "Good" if lcp_val < 2500 else ("Needs work" if lcp_val < 4000 else "Poor")
        col_lcp.metric("LCP (p75)", f"{lcp_val:,}ms", delta=lcp_status)

    inp_val = cwv_df["inp_p75_start"].iloc[-1] if not cwv_df.empty else None
    if inp_val is not None:
        inp_status = "Good" if inp_val < 200 else ("Needs work" if inp_val < 500 else "Poor")
        col_inp.metric("INP (p75)", f"{inp_val}ms", delta=inp_status)

    cls_val = cwv_df["cls_p75_start"].iloc[-1] if not cwv_df.empty else None
    if cls_val is not None:
        cls_status = "Good" if cls_val < 0.1 else ("Needs work" if cls_val < 0.25 else "Poor")
        col_cls.metric("CLS (p75)", f"{cls_val:.3f}", delta=cls_status)

    # Show the correlation chart only if we have enough data
    if len(cwv_df) >= 3:
        st.subheader("Ranking vs CWV Correlation (Spearman)")
        st.caption("Positive correlation = worse CWV scores associated with worse rankings. P < 0.05 = statistically meaningful.")
Wiring in AI Agent Summaries
This is the part that surprised me most. Adding an LLM-powered summary panel to the dashboard took about 90 minutes and immediately became the most-used feature.
The pattern: after data loads, send a structured JSON summary of the key metrics to Claude's API. Get back a plain-English summary with the two or three things that most need attention. Display it in a collapsible panel at the top of each tab.
# analysis/ai_summary.py — Python 3.13
# Requires: anthropic>=0.40.0

from __future__ import annotations

import json
import streamlit as st
import anthropic


@st.cache_data(ttl=3600, show_spinner=False)
def generate_performance_summary(
    metrics_json: str,
    period_label: str,
) -> str:
    """
    Send key metrics to Claude and get a plain-English summary.
    Input is JSON string so it's hashable for st.cache_data.
    TTL 1 hour — no need to regenerate on every filter change.
    """
    client = anthropic.Anthropic(api_key=st.secrets["anthropic"]["api_key"])

    message = client.messages.create(
        model="claude-sonnet-4-5",
        max_tokens=400,
        system=(
            "You are an SEO analyst assistant. The user will give you a JSON summary "
            "of their Search Console performance data. Write 2-3 short sentences "
            "identifying the most important pattern or issue. Be direct and specific. "
            "Do not use phrases like 'it's worth noting' or 'overall'. Just state findings."
        ),
        messages=[
            {
                "role": "user",
                "content": f"Period: {period_label}\n\nMetrics:\n{metrics_json}",
            }
        ],
    )
    return message.content[0].text


def build_metrics_summary(current_df, compare_df) -> str:
    """Build a compact JSON summary of key metrics for the LLM."""
    summary = {
        "current_clicks": int(current_df["clicks"].sum()),
        "previous_clicks": int(compare_df["clicks"].sum()),
        "click_change_pct": round(
            (current_df["clicks"].sum() - compare_df["clicks"].sum())
            / max(compare_df["clicks"].sum(), 1)
            * 100,
            1,
        ),
        "current_avg_position": round(current_df["position"].mean(), 1),
        "previous_avg_position": round(compare_df["position"].mean(), 1),
        "urls_with_click_drop_over_30pct": int(
            (
                (current_df.groupby("page")["clicks"].sum()
                 - compare_df.groupby("page")["clicks"].sum())
                / compare_df.groupby("page")["clicks"].sum().replace(0, 1)
            )
            .lt(-0.30)
            .sum()
        ),
        "top_3_declining_urls": (
            current_df.groupby("page")["clicks"].sum()
            .subtract(compare_df.groupby("page")["clicks"].sum(), fill_value=0)
            .nsmallest(3)
            .index.tolist()
        ),
    }
    return json.dumps(summary, indent=2)
The cache TTL on this function is one hour. The LLM summary doesn't need to regenerate every time a user changes a date filter. It regenerates once per hour maximum, which costs roughly $0.003 per regeneration using Sonnet. For seven client dashboards with maybe three summary panels each, that's well under $1/day in LLM costs.
Authentication Without Losing Clients
This is where I made the most mistakes. My first auth implementation used a hard-coded password in st.secrets and a simple session state check. It worked fine for technical clients. It was a disaster for anyone who wasn't used to logging into tools.
The Streamlit 1.40 st.login() implementation with Google OAuth is categorically better. Setup takes about 20 minutes (create OAuth credentials in Google Cloud Console, add to secrets.toml, two lines of code). Users authenticate with their existing Google account. No password to forget, no separate login to remember.
# .streamlit/secrets.toml

[auth]
redirect_uri = "https://your-dashboard.yourdomain.com/oauth2callback"
cookie_secret = "your-random-secret-here-32-chars-minimum"

[auth.google]
client_id = "your-google-oauth-client-id"
client_secret = "your-google-oauth-client-secret"

[allowed_users]
emails = [
    "[email protected]",
    "[email protected]",
    "[email protected]"
]

[gcp]
project_id = "your-gcp-project"
# Service account JSON inline for deployment
service_account_json = """
{
  "type": "service_account",
  ...
}
"""

[client]
site_url = "https://www.client-site.com/"
site_origin = "https://www.client-site.com"

[anthropic]
api_key = "sk-ant-..."
One thing that bit me: the OAuth callback URL must match exactly what's registered in Google Cloud Console. Include or exclude the trailing slash consistently. I spent 45 minutes debugging a redirect_uri_mismatch error that was caused by a single trailing slash discrepancy. Write it down the first time you get it working.
Deployment: VPS vs Community Cloud
Streamlit Community Cloud is free and zero-ops. For internal tooling or personal projects, it's the right call. For client-facing dashboards, it has three problems: you can't guarantee uptime SLAs, the cold-start latency when a sleeping app wakes up is genuinely bad (8–12 seconds), and you have limited control over resource allocation.
I run all client dashboards on a $24/month Hetzner VPS (CPX21: 3 vCPU, 4GB RAM, 80GB SSD). That box handles seven concurrent Streamlit apps using nginx reverse proxy. Each app runs as a systemd service. Total infrastructure cost per client dashboard: $3.43/month at seven apps on one box. That's it.
# /etc/systemd/system/seo-dashboard-clientname.service

[Unit]
Description=SEO Dashboard — ClientName
After=network.target

[Service]
Type=simple
User=streamlit
WorkingDirectory=/opt/dashboards/clientname
Environment="PYTHONPATH=/opt/dashboards/clientname"
ExecStart=/opt/dashboards/clientname/.venv/bin/streamlit run app/dashboard.py \
    --server.port 8501 \
    --server.address 127.0.0.1 \
    --server.headless true \
    --browser.gatherUsageStats false
Restart=on-failure
RestartSec=10

[Install]
WantedBy=multi-user.target
# /etc/nginx/sites-available/seo-dashboard-clientname

server {
    listen 443 ssl http2;
    server_name clientname-dashboard.yourdomain.com;

    ssl_certificate /etc/letsencrypt/live/clientname-dashboard.yourdomain.com/fullchain.pem;
    ssl_certificate_key /etc/letsencrypt/live/clientname-dashboard.yourdomain.com/privkey.pem;

    location / {
        proxy_pass http://127.0.0.1:8501;
        proxy_http_version 1.1;
        proxy_set_header Upgrade $http_upgrade;
        proxy_set_header Connection "upgrade";
        proxy_set_header Host $host;
        proxy_set_header X-Real-IP $remote_addr;
        proxy_read_timeout 86400;  # Keep WebSocket connections alive
    }
}
Certbot handles SSL. Each client gets a subdomain. The WebSocket timeout matters — Streamlit uses WebSockets for real-time updates and the default nginx timeout will kill the connection mid-session without that setting.
The Dashboard I Rebuilt Three Times
Client with a large e-commerce site. They wanted a page-level performance view that showed, for each category page, the top 5 organic keywords driving traffic, the current position for each keyword, the CWV score, the internal link count, and whether the page was in the sitemap.
That's five data sources. First attempt: I queried all five sources inside Streamlit on page load. Load time: 47 seconds. Non-starter.
Second attempt: I moved the slow queries behind a "Refresh Data" button. Load time on button click: still 31 seconds because three of the queries couldn't be parallelized easily in the approach I'd used. The client pressed the button once, waited, and then asked if the dashboard was broken.
Third attempt: pre-join everything in BigQuery using a scheduled query that runs at 04:00 UTC daily. Streamlit queries a single pre-built BigQuery view that has all five data sources already joined. Load time: 1.8 seconds. This is what I should have done first.
The lesson I've internalized: any join that requires more than two data sources belongs in the data warehouse, not in the app. Streamlit is for display. BigQuery is for transformation. The CACHE framework I described earlier is directly a consequence of building and scrapping that dashboard twice.
Two Contrarian Takes Before I'm Done
First: the SEO community overcredits Looker Studio for client reporting. Looker Studio dashboards are easy to build but hard to make actually useful. The default GA4 + GSC templates look impressive in a proposal and get ignored after the first month because they don't answer the questions clients actually have. A Streamlit dashboard that answers three specific questions the client cares about gets used every week. I've watched this pattern across all seven clients I migrated.
Second: Streamlit is not the right answer if you're not writing Python already. I've seen SEOs try to adopt Streamlit as their first Python project and it goes badly. The app framework hides a lot of complexity, and when something breaks, the debugging experience assumes Python familiarity. If you're not comfortable with virtual environments, debugging import errors, and reading stack traces — stay on Looker Studio. The data analysis capabilities you're missing are real, but so is the maintenance overhead.
The Honest Accounting
Eleven weeks to migrate seven dashboards. If I had to quantify the value: three clients have mentioned the new dashboards unprompted in conversations, in a positive way. One asked why the data looks different — because we were fixing incorrect metric definitions that Looker Studio's calculated fields had been computing wrong for months. That conversation was uncomfortable but the fix was right.
The infrastructure cost went from $0 (Looker Studio is free) to $24/month (the VPS). I consider that a cost of doing better work, not a downside.
The part nobody writes about: the quality of my own analysis improved. When you can manipulate data programmatically, you stop asking "what does the dashboard show" and start asking "what's the right question to ask." That shift is real and it's the part that Looker Studio was preventing without me fully noticing.
The Python modules feeding these dashboards are covered in my 2026 Python SEO library audit. The Airflow pipelines that populate the BigQuery tables are in the Airflow 3.x DAG rebuild. The n8n workflows that handle lighter-weight data collection are in the n8n workflow audit.
Code tested on Streamlit 1.41.0, Python 3.13.2. The st.experimental_user API was marked stable in 1.40 — earlier versions use a different attribute path. Check the Streamlit user API docs if you're on an older version.