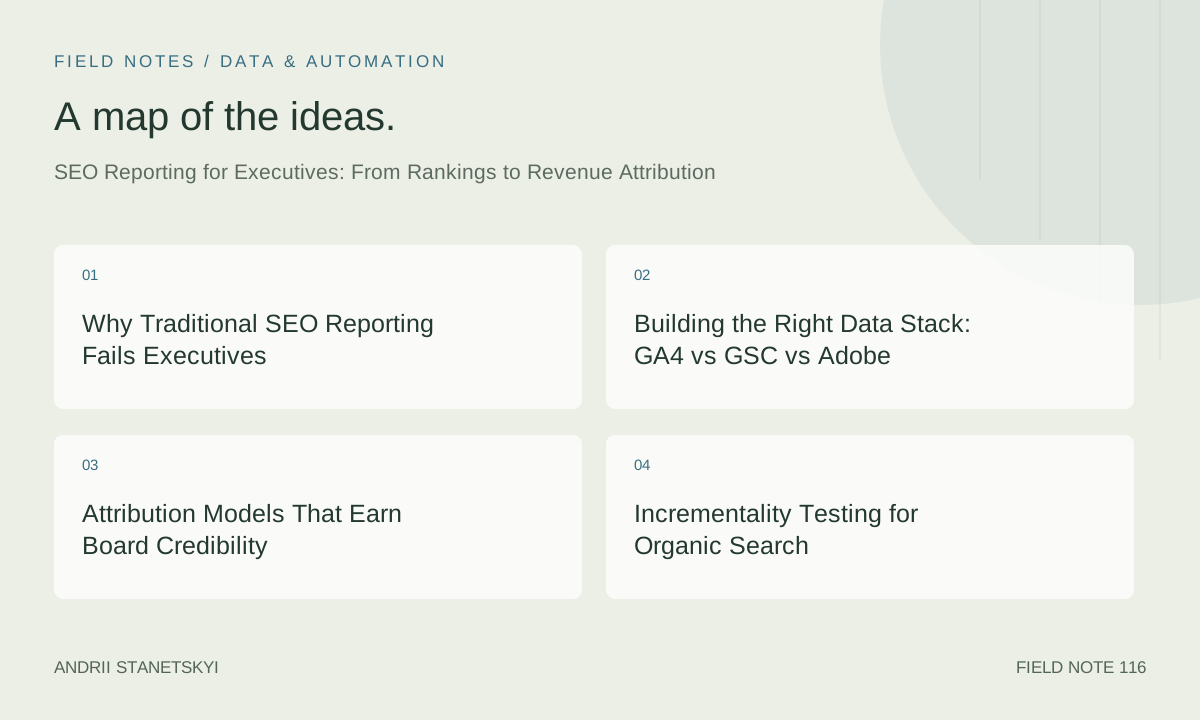
Rankings are a vanity metric until they're tied to dollars. In 2026, no CFO or board member signs off on an expanded SEO budget because a brand moved from position 8 to position 4 on a keyword nobody buys. What they respond to is incremental revenue, customer acquisition cost displacement, and lifetime-value leverage — framed in the same language finance uses every quarter. This guide rebuilds SEO reporting from the ground up for the executive audience: connecting Google Search Console signals to GA4 conversions, layering in multi-touch attribution and media-mix modelling, and packaging everything into board-room-ready Looker Studio dashboards that survive a CFO's first question.
Why Traditional SEO Reporting Fails Executives
Most SEO reports handed to leadership are built for SEO practitioners, not decision-makers. They open with rank-tracking tables, close with a crawl-error count, and somewhere in the middle hope that "organic traffic grew 12% MoM" lands as meaningful. It rarely does.
Executives operate in a framework of capital allocation. Every dollar spent on SEO competes with paid search, paid social, field sales, and product development. To win that competition, SEO must demonstrate:
- Revenue attribution — not just assisted conversions, but last-meaningful-touch and modelled incremental revenue.
- Cost efficiency — customer acquisition cost compared to paid channels, with a decay curve showing how SEO's CAC improves over time.
- Scalability evidence — a model showing what additional investment produces in incremental revenue, not just traffic.
- Risk surface — algorithm exposure, branded dependency, and competitive moat durability.
None of these appear in a standard rank-tracker export. Building them requires deliberate instrumentation across your analytics stack and a reporting architecture designed for the executive context.
[Internal link: SEO Strategy Overview]
Building the Right Data Stack: GA4 vs GSC vs Adobe
Google Analytics 4
GA4's event-based model is both its strength and its complexity for SEO attribution. Every organic session is tied to a session_source and session_medium dimension, but the default last-click model undercounts organic's role in long consideration cycles. For executive reporting, configure the following:
- Enable Google Signals and cross-device reporting to capture organic's influence across devices before a purchase closes on desktop.
- Create a custom GA4 Exploration using the Funnel Exploration template filtered to
session_medium = organic, segmented by landing page category (informational, commercial, transactional). - Export raw events to BigQuery daily. This is non-negotiable for any revenue attribution work beyond last-click.
Google Search Console
GSC is the only source of impression-level data Google provides directly. Its limitation — no user-level data, no conversion data — means it anchors the top of the funnel. Link GSC to GA4 via the native integration and to BigQuery via the [External: Google Search Console API documentation] for query-level analysis at scale.
The critical metric executives rarely see from GSC: Click-weighted average position for revenue-generating query clusters. This shows whether visibility gains are happening on keywords that actually drive pipeline, not long-tail queries with zero commercial intent.
Adobe Analytics vs GA4
Enterprises running Adobe Analytics have a richer attribution toolkit out of the box — Algorithmic Attribution (formerly Algorithmic Attribution IQ) applies data-driven weights across the entire touchpoint sequence. The trade-off: Adobe's organic channel requires careful eVar mapping to separate branded from non-branded organic, a distinction GA4 handles more cleanly through Search Console integration.
For hybrid stacks, use BigQuery as the canonical revenue attribution layer. Pull GA4 events and Adobe hits into a unified session-stitching model rather than trusting either platform's native attribution in isolation.
Attribution Models That Earn Board Credibility
Multi-Touch Attribution (MTA)
MTA assigns fractional credit to each touchpoint in the conversion path. In 2026, the data-driven MTA model available natively in GA4 is the minimum standard for executive reporting. It uses observed conversion paths to weight touches algorithmically — organic search typically receives significantly more credit under data-driven than under last-click, because it disproportionately appears in early and mid-funnel positions.
The limitation of MTA: it only measures what's measurable. Dark social, podcast mentions, and cross-device gaps leave attribution holes that inflate paid channels (which have deterministic click tracking) and deflate organic (which relies on session stitching).
Media Mix Modelling (MMM)
MMM operates at an aggregate level — it regresses revenue against channel spend, seasonality, and external variables to estimate each channel's contribution without relying on user-level tracking. For SEO, MMM is unusually powerful because organic search has a clear "spend proxy" in the form of content production and technical investment costs.
In practice, position MMM findings alongside MTA in executive decks: "Our MTA model shows organic driving 28% of attributed revenue; our MMM confirms organic's contribution at 24–31% across quarterly models." Agreement between methods builds credibility. Divergence invites deeper analysis — and surfaces the story of what's being missed.
Choosing the Right Model for the Audience
| Model | Best For | SEO Strength | SEO Weakness | Executive Credibility |
|---|---|---|---|---|
| Last Click (GA4) | Quick channel-level snapshots | Simple to explain | Severely undercounts organic | Low — finance knows it's wrong |
| Data-Driven MTA (GA4) | Path-level digital attribution | Rewards early/mid-funnel role | Blind to offline and cross-device gaps | Medium — accepted for digital-only businesses |
| Algorithmic Attribution (Adobe) | Enterprise with rich eVar data | Flexible weighting rules | Complex to audit and explain | Medium-High with proper documentation |
| Media Mix Modelling | Board-level budget decisions | Captures full organic contribution | Requires 18–24 months of clean data | High — preferred by CFOs and CMOs |
| Incrementality Testing | Proving organic's true causal lift | Gold standard for causality | Expensive and slow to run | Very High — treated as experimental proof |
Incrementality Testing for Organic Search
Incrementality answers the question no attribution model can: "Would this revenue have happened without our SEO investment?" The methodology borrows from controlled experiments used in paid media:
Geo-Based Holdout Tests
Suppress SEO investment (content publication, link building) in a matched set of geographic markets for a defined period. Measure revenue difference between test and control markets, adjusted for baseline trends and seasonality. This is the cleanest test design for organic but requires either significant geographic diversity in your customer base or a long enough test window to see signal through noise.
Page-Level Holdouts
For content-heavy sites, create a holdout cohort of URLs that receive no new content updates or link-building attention for a quarter. Compare their traffic and revenue trajectory to actively invested pages matched by initial traffic, topic, and competitive density. The delta is a conservative proxy for organic incrementality at the content level.
Present incrementality results to executives as a range: "Our holdout test suggests organic search drives between $2.1M and $3.4M in incremental revenue annually that would not occur through other channels." Ranges signal methodological honesty, which builds more trust than false precision.
[Internal link: Content Strategy ROI]
Framing SEO Inside CAC/LTV Economics
This is the reframe that changes every executive conversation about SEO. Paid acquisition has a well-understood cost structure: CPM, CPC, CAC, and payback period. SEO requires a parallel framing:
Organic CAC Calculation
Organic CAC = (Total SEO Investment in Period) ÷ (New Customers Attributed to Organic in Period)
Total SEO investment must include: internal headcount fully-loaded cost, agency or freelancer fees, content production costs, tool subscriptions, and a proportional share of technical infrastructure (CDN, CMS, page speed optimisation). Most teams undercount by 40–60% by excluding headcount and infrastructure — which makes organic CAC look artificially low in ways that erode credibility when finance audits the number.
The CAC Decay Curve
The single most powerful SEO economic argument: unlike paid media where CAC resets to zero when spend stops, organic CAC decays favourably over time because content assets continue generating customers after the initial production investment. Model this as a cohort — content published in Q1 2024, what is its cumulative customer count through Q1 2026, and what is the resulting blended CAC across that 24-month window?
In most category-leader content programmes, organic CAC at 24 months is 60–80% lower than paid search CAC for the same keyword intent. This is the slide that gets budget approved.
LTV Differential
Segment customers by acquisition channel and compare 12-month LTV. Organic-acquired customers frequently show 15–25% higher LTV than paid-acquired customers, driven by higher intent at acquisition and lower refund/churn rates. This is a hypothesis worth testing in your own data before asserting it to the board, but the pattern is consistent enough across industries to be worth investigating.
[Internal link: LTV by Channel Analysis]
The Executive SEO Reporting Framework
Structure every executive SEO report in three layers: business outcomes, channel performance, and operational indicators. Executives engage at layer one; they delegate layers two and three to directors and managers.
Layer 1: Business Outcomes (Board / C-Suite)
- Organic-attributed revenue (MTA and MMM, with methodology note)
- Organic CAC vs paid CAC, trended quarterly
- Incremental revenue from SEO (holdout-tested, confidence interval)
- Organic share of new customer acquisition
- Branded vs non-branded organic revenue split
Layer 2: Channel Performance (CMO / VP Marketing)
- Non-branded organic sessions and conversion rate by intent tier
- Query-category revenue mapping (commercial queries driving pipeline)
- Content ROI by cluster (investment vs attributed revenue, 12-month window)
- Competitive share of voice by revenue-generating query set
- Core Web Vitals and page experience index by revenue-weighted URL tier
Layer 3: Operational Indicators (SEO Director / Manager)
- Indexed URL count and crawl budget efficiency
- Backlink velocity and domain authority distribution
- Rank distribution shifts across keyword universe
- Technical issue backlog and resolution velocity
Looker Studio Templates and Formulas
The following Looker Studio calculated fields power the executive revenue layer of an organic search dashboard connected to a BigQuery data source containing joined GA4 events and GSC data.
Organic CAC Calculated Field
// Looker Studio Calculated Field: Organic CAC
// Source: BigQuery blended data source (ga4_sessions + cost_data)

CASE
  WHEN SUM(organic_new_customers) = 0 THEN NULL
  ELSE SUM(total_seo_investment) / SUM(organic_new_customers)
END

// Display format: Currency (2 decimal places)
// Comparison: Add paid_cac field with same structure for side-by-side bar chart
Non-Branded Organic Revenue Share
// Looker Studio Calculated Field: Non-Branded Organic Revenue %
// Requires: branded_organic_revenue, total_organic_revenue fields

(SUM(total_organic_revenue) - SUM(branded_organic_revenue))
/ SUM(total_organic_revenue)

// Display format: Percent (1 decimal place)
// Context: Branded organic revenue reflects brand equity, not SEO investment returns
// Non-branded share is the metric that reflects SEO programme effectiveness
Content Cluster ROI
// Looker Studio Calculated Field: Content Cluster ROI (12-month)
// Fields needed: cluster_revenue_attributed_12m, cluster_production_cost

(SUM(cluster_revenue_attributed_12m) - SUM(cluster_production_cost))
/ SUM(cluster_production_cost)

// A value of 3.2 = 320% ROI = $4.20 return per $1 invested
// Use this in a table sorted descending to identify highest-performing clusters
// and lowest-performing clusters warranting consolidation or pruning
BigQuery SQL for Revenue Attribution
The following queries operate on the standard GA4 BigQuery export schema. Adapt dataset and table names to your project structure.
Organic Session to Revenue Path Query
-- BigQuery SQL: Organic first-touch revenue attribution
-- Identifies sessions where organic search was the first touch
-- and attributes any revenue converted within 30 days

WITH organic_first_touch AS (
  SELECT
    user_pseudo_id,
    MIN(event_timestamp) AS first_organic_touch_ts,
    MIN(DATE(TIMESTAMP_MICROS(event_timestamp))) AS first_organic_date
  FROM your_project.analytics_XXXXXXXXX.events_*
  WHERE
    _TABLE_SUFFIX BETWEEN FORMAT_DATE('%Y%m%d', DATE_SUB(CURRENT_DATE(), INTERVAL 90 DAY))
      AND FORMAT_DATE('%Y%m%d', CURRENT_DATE())
    AND traffic_source.medium = 'organic'
    AND event_name = 'session_start'
  GROUP BY user_pseudo_id
),

purchases AS (
  SELECT
    user_pseudo_id,
    event_timestamp AS purchase_ts,
    (SELECT value.double_value FROM UNNEST(event_params) WHERE key = 'value') AS revenue
  FROM your_project.analytics_XXXXXXXXX.events_*
  WHERE
    _TABLE_SUFFIX BETWEEN FORMAT_DATE('%Y%m%d', DATE_SUB(CURRENT_DATE(), INTERVAL 90 DAY))
      AND FORMAT_DATE('%Y%m%d', CURRENT_DATE())
    AND event_name = 'purchase'
)

SELECT
  oft.first_organic_date,
  COUNT(DISTINCT oft.user_pseudo_id) AS organic_users,
  COUNT(DISTINCT p.user_pseudo_id) AS converted_users,
  ROUND(SUM(p.revenue), 2) AS attributed_revenue,
  ROUND(SUM(p.revenue) / COUNT(DISTINCT oft.user_pseudo_id), 2) AS revenue_per_organic_user
FROM organic_first_touch oft
LEFT JOIN purchases p
  ON oft.user_pseudo_id = p.user_pseudo_id
  AND p.purchase_ts >= oft.first_organic_touch_ts
  AND p.purchase_ts <= oft.first_organic_touch_ts + (30 * 24 * 60 * 60 * 1000000)  -- 30-day window
GROUP BY oft.first_organic_date
ORDER BY oft.first_organic_date DESC;
Non-Branded Query Revenue Mapping
-- BigQuery SQL: Join GSC query data with GA4 landing page revenue
-- Requires GSC BigQuery export (via Supermetrics, Fivetran, or custom connector)
-- and GA4 landing page revenue table

SELECT
  gsc.query,
  gsc.page AS landing_page,
  SUM(gsc.clicks) AS total_clicks,
  SUM(gsc.impressions) AS total_impressions,
  ROUND(SUM(gsc.clicks) / NULLIF(SUM(gsc.impressions), 0), 4) AS ctr,
  ROUND(AVG(gsc.position), 1) AS avg_position,
  ROUND(SUM(lp.revenue_attributed), 2) AS landing_page_revenue,
  ROUND(SUM(lp.revenue_attributed) / NULLIF(SUM(gsc.clicks), 0), 2) AS revenue_per_click
FROM your_project.gsc_export.searchdata_url_impression gsc
LEFT JOIN your_project.ga4_derived.landing_page_revenue lp
  ON gsc.page = lp.landing_page
WHERE
  gsc.data_date >= DATE_SUB(CURRENT_DATE(), INTERVAL 28 DAY)
  AND gsc.query NOT LIKE '%your_brand_name%'  -- exclude branded queries
GROUP BY gsc.query, gsc.page
HAVING SUM(gsc.clicks) >= 50  -- filter for statistical relevance
ORDER BY landing_page_revenue DESC
LIMIT 200;
[Internal link: BigQuery GA4 Setup Guide]
GA4 Exploration Setup: Organic Revenue Path
// GA4 Exploration Configuration (Path Exploration)
// Goal: Visualise the organic session → conversion journey

Technique: Path exploration
Start point: Session start (filtered: session_medium = "organic")
Steps:
  Step 1: Landing page category (custom dimension)
  Step 2: Engagement event (scroll_depth_75, video_play, form_start)
  Step 3: Purchase OR lead_form_submit

Segments applied:
  - Non-branded organic sessions
  - New users only (for CAC analysis)

Breakdown dimension: Device category
Date range: Last 90 days (minimum for path significance)

// Export to BigQuery for deeper SQL analysis
// Use this to identify highest-converting organic entry paths
// and prioritise content investment accordingly
[Internal link: Analytics Infrastructure Best Practices]
Frequently Asked Questions
How do I present SEO ROI when we use last-click attribution in our CRM?
Last-click attribution in CRMs (Salesforce, HubSpot) systematically undercounts organic because organic sessions frequently occur early in the buying journey, with a paid or direct session closing the sale. The fix has two parts: first, implement UTM-based source tracking rigourously so the CRM captures the correct last digital touch; second, run a parallel GA4 data-driven attribution report to show leadership the difference between last-click and multi-touch organic contribution. Frame it as "our CRM shows organic attributing $X; our full-path model shows organic contributing $Y — the gap represents organic's early-funnel role that last-click accounting misses."
What is the right reporting cadence for executive SEO dashboards?
Monthly is the minimum meaningful cadence for revenue-level SEO reporting. Weekly organic traffic reports to a CMO are noise — algorithm fluctuations, seasonality, and indexing delays make week-over-week comparisons misleading without context. Build a monthly executive summary (one slide or one dashboard section) showing the three business-outcome metrics trending over 12 months. Supplement with quarterly deep-dives on CAC, LTV, and incrementality results. Reserve weekly reporting for operational teams monitoring crawl health and rank shifts during active campaigns or post-migration periods.
How should we handle the Google algorithm update narrative with the board?
Algorithm updates need to be pre-framed before they happen, not explained reactively after a traffic drop. Include in your standing executive dashboard a "risk exposure" metric: branded traffic as a percentage of total organic (high branded dependency = fragile non-branded position), and a query-diversity index (traffic concentration across your top 10 queries). When an update hits, present it in the same frame as any market event: "The September 2025 core update impacted sites with thin content; our content quality investment over the prior 18 months resulted in a 4% lift while category peers saw average declines of 12%." Algorithm resilience becomes a competitive moat narrative.
Can we really compare organic CAC to paid CAC given the cost-accounting differences?
Yes, with explicit methodology disclosure. The key is consistent amortisation: if a piece of content costs $3,000 to produce and generates customers over 36 months, its monthly contribution to CAC should use an amortised cost of $83/month, not the full production cost in month one. Apply the same amortisation logic that finance uses for any long-lived asset. The resulting organic CAC is genuinely comparable to paid CAC, which is incurred in the month the spend occurs. Fully-loaded organic CAC including amortised content, headcount, tools, and infrastructure is typically 40–70% below equivalent-intent paid CAC at 18 months post-publication — a result that holds up to financial scrutiny.
What does a good SEO executive report look like in terms of length and format?
For a board or C-suite audience: one page maximum, three to five metrics, trend arrows, and a single action or decision required. For a CMO or VP Marketing: a Looker Studio dashboard with five to eight charts, a 250-word narrative summary, and a recommendation section. For a quarterly business review: a 10-slide deck structure — executive summary, revenue attribution, CAC/LTV comparison, competitive position, incrementality evidence, content ROI by cluster, risk surface, and three recommended investments with projected return ranges. Resist the temptation to include rank tables or crawl data in executive formats; these belong in the operational appendix available on request.
How do we attribute revenue from AI Overviews and zero-click searches?
This is the defining measurement challenge of 2026. AI Overviews and featured snippets generate brand exposure and recall that influence conversion without generating a measurable click. The best available proxy: brand search volume lift. Monitor branded query volume in GSC for a period following significant AI Overview appearances (use GSC's "appearance type" filter). A statistically significant lift in branded search after non-branded AI Overview impressions suggests organic brand-building that eventually closes revenue through direct or branded organic sessions. Include this as a qualitative addendum to your executive report: "Non-branded AI Overview appearances increased 340% this quarter; branded search volume lifted 18% in the same period, contributing an estimated $X in branded organic revenue."
Should we include competitor SEO metrics in executive reporting?
Yes, always. Executives evaluate performance relative to alternatives — absolute numbers without competitive context invite the question "is that good?" Include: share of voice for your top 20 revenue-generating query clusters (Semrush, Ahrefs, or Sistrix data), estimated organic traffic share vs top three competitors, and content gap analysis showing query categories where competitors rank and you do not. Frame competitor metrics as market opportunity, not threat: "Competitor A ranks for 340 commercial queries in the [category] cluster where we have no content; our content investment plan targets capturing 30% of that query set within 18 months, representing an estimated $1.2M in incremental attributed revenue."
Key Takeaways
- Translate rankings to revenue before presenting to any executive audience. Rank data belongs in operational reports; revenue attribution data belongs in board decks.
- Use multi-touch attribution as a minimum standard and supplement with MMM for quarterly and annual budget discussions. Agreement between models builds credibility; divergence surfaces important measurement gaps.
- Incrementality testing is the gold standard for proving SEO's causal contribution. Even a single geo-based holdout test annually provides defensible evidence for budget expansion.
- CAC/LTV framing puts SEO in the same economic language as every other growth channel. Calculate fully-loaded organic CAC including amortised content costs and headcount; the result is almost always favourable compared to paid channels at 18+ months.
- Layer your reporting by audience: business outcomes for the board, channel performance for the CMO, operational indicators for the SEO team. Each layer should be self-contained so executives never have to wade through rank tables to find revenue numbers.
- BigQuery + Looker Studio is the 2026 standard stack for executive SEO reporting. Native GA4 reporting is insufficient for revenue attribution at the query and content-cluster level; BigQuery SQL unlocks the analysis that earns budget.
- Branded vs non-branded organic split is the single most important segmentation for executive credibility. Non-branded organic revenue is the return on SEO investment; branded organic revenue reflects brand equity built across all channels.
Conclusion
The gap between how SEO teams think about their work and how executives fund it is a measurement and translation problem. Rankings and crawl health matter operationally, but they are intermediate metrics — inputs to a machine whose output is revenue, customer acquisition, and lifetime value. The executives who fund SEO programmes are not indifferent to the channel; they are indifferent to metrics they cannot connect to a P&L line.
Closing that gap requires deliberate infrastructure choices — BigQuery exports, MTA configuration, content cost tracking — and a reporting architecture that presents the right metric to the right audience at the right cadence. The frameworks, SQL queries, and Looker Studio formulas in this guide provide the technical foundation. The harder work is the narrative: building the board-room case that organic search is not a marketing cost but a customer acquisition asset with a decay-adjusted CAC that outperforms paid channels at scale and an incrementality profile that survives scrutiny from finance.
Make that case consistently, with clean data and rigorous methodology, and SEO earns the budget allocation it deserves — not because executives suddenly care about rankings, but because the revenue case is too clear to ignore.