Published: · Reading time: ~18 min · Audience: senior SEOs, data scientists, technical strategists
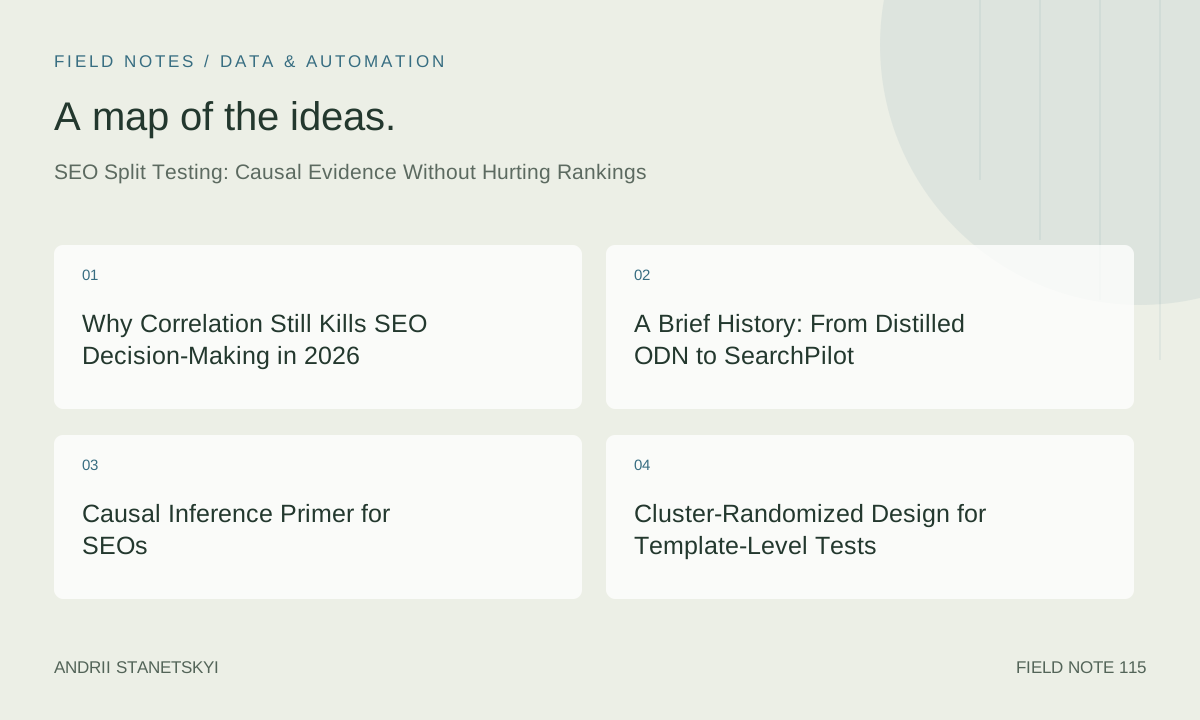
Why Correlation Still Kills SEO Decision-Making in 2026
Every SEO team has a graveyard of changes that "worked" in a before/after comparison and later turned out to be seasonal lift, a Google algorithm update, or a competitor meltdown. The before/after narrative is seductive because it is simple. It is also scientifically indefensible without a counterfactual.
Causal identification in SEO is genuinely hard. You cannot randomly assign queries to treatment and control. Googlebot indexes pages, not sessions. Algorithm updates cascade across your entire domain simultaneously. And yet, the multi-billion-dollar decisions that depend on organic search — content strategy, title-tag templates, schema rollouts, internal linking architectures — deserve the same evidentiary standard we demand of pharmaceutical trials.
This article is a practitioner's guide to achieving that standard. We cover cluster-randomized experiments, time-series causal inference with Google's open-source CausalImpact, power analysis, and the tooling that industrializes the process. We also explain precisely where each approach can fail and what guard-rails prevent a test from silently damaging rankings before you notice.
See also: [Internal: Technical SEO Audit Framework] and [Internal: Google Algorithm Update Tracker 2026] for the broader context in which these experiments live.
A Brief History: From Distilled ODN to SearchPilot
The intellectual lineage of rigorous SEO experimentation is short but instructive. In 2013, Tom Anthony at Distilled introduced the concept of Distilled ODN (Optimization Delivery Network) — a CDN-layer proxy that served two versions of a page exclusively based on the crawling agent's identity. The core insight was elegant: if Googlebot receives treatment and users receive control (or vice versa), you get a pure signal about how Google's ranking algorithm responds to a change, isolated from user-behavior noise.
ODN was eventually sunset and reborn as SearchPilot, which Distilled spun out in 2019. SearchPilot industrialized the ODN idea into a managed SaaS platform capable of running template-level experiments across tens of thousands of URLs simultaneously. The platform handles variant delivery, holdout construction, and statistical analysis — including its own time-series modeling layer to account for algorithmic volatility.
Meanwhile, enterprise platforms like Conductor and Botify began integrating experimentation modules, targeting marketing organizations that lack the engineering resources to build custom experiment infrastructure on top of their CMS. By 2025, experimentation had become a standard feature expectation rather than a competitive differentiator in the enterprise SEO platform market.
What has not changed is the underlying statistical challenge: organic search is not a controlled environment, and any methodology that pretends otherwise will eventually produce garbage outputs that destroy stakeholder trust.
Causal Inference Primer for SEOs
Rubin's Potential Outcomes Framework
The Rubin Causal Model frames every causal question around two potential outcomes for each unit: Y(1), the outcome if treated, and Y(0), the outcome if not treated. The individual treatment effect is Y(1) − Y(0) — but you can only ever observe one of the two. This is the "fundamental problem of causal inference."
In SEO terms, each URL template is a unit. You cannot simultaneously show Googlebot the old title tag and the new title tag for the same URLs. You must compare across similar groups (cross-sectional cluster randomization) or across time on a synthetic control (time-series causal inference). Both designs estimate the Average Treatment Effect on the Treated (ATT) rather than individual-level effects.
The implication: even a perfectly designed SEO experiment gives you a population-level estimate, not a guarantee about any individual URL. Keep that scope of inference in mind when presenting results.
Frequentist t-test vs. Bayesian Inference
A naive frequentist approach to SEO experiment analysis might compare mean click-through rates between treatment and control clusters with a Welch t-test. This works in large-N scenarios with roughly normal residuals, but SEO metrics — clicks, impressions, click-through rate — are typically count or rate data with high day-of-week autocorrelation and right-skewed distributions. A raw t-test on raw clicks will routinely produce p-values that cannot be trusted.
The Bayesian alternative — most accessibly implemented via Google's CausalImpact package — fits a structural time-series model to a control time series (a synthetic control constructed from unaffected URL clusters or unaffected similar sites), then asks: how likely is the observed post-intervention behavior under the counterfactual? The output is a posterior distribution over the causal effect, with credible intervals that communicate uncertainty honestly.
Bayesian credible intervals say "given the data and our prior, the true effect lies here with 95% probability." Frequentist confidence intervals say "if we repeated this experiment many times, 95% of such intervals would contain the true value." For SEO stakeholders, the Bayesian framing is almost always more actionable. For regulatory or legal contexts, the frequentist framing may be required.
Cluster-Randomized Design for Template-Level Tests
The defining feature of SEO experimentation is that the unit of randomization is not the individual page but a cluster of pages sharing a template. Randomizing at the page level within a template is dangerous: Google may canonicalize or compare nearby pages and observe an inconsistency that triggers quality signals. Randomizing by template (or by URL pattern within a template) isolates the experiment to a cohesive set of pages that Google already treats as a logical group.
A well-specified cluster-randomized SEO experiment has these components:
- Template selection: Choose a template with ≥500 URLs and sufficient pre-experiment traffic history (minimum 8 weeks recommended) to allow synthetic control construction.
- Stratified randomization: Sort clusters by pre-period clicks descending and use alternating assignment (or matched pairs) rather than purely random assignment to balance baseline traffic between arms.
- Holdout (control) arm: The control arm receives zero change and is used to build a synthetic control time series. It should be at least as large as the treatment arm in URL count.
- Intervention window: Run the test long enough for Googlebot to recrawl and reindex the treatment cluster. For large sites, this may require 3–6 weeks post-launch before signal stabilizes.
- Pre-period validation: Verify that treatment and control arms have parallel trends in the pre-period. A significant divergence before the intervention invalidates the assumption underlying the synthetic control.
The following Python snippet illustrates stratified cluster assignment:
import pandas as pd
import numpy as np

def stratified_cluster_assign(df: pd.DataFrame,
                               cluster_col: str = "url_pattern",
                               metric_col: str = "clicks_p90d",
                               seed: int = 42) -> pd.DataFrame:
    """
    Assigns URL-pattern clusters to treatment/control via
    stratified (sorted) alternating assignment.

    Args:
        df: DataFrame with one row per cluster.
        cluster_col: Column identifying the cluster.
        metric_col: Pre-period metric for stratification.
        seed: Random seed for tie-breaking.
    Returns:
        DataFrame with added 'arm' column ('treatment'|'control').
    """
    rng = np.random.default_rng(seed)
    df = df.copy()
    # Add small noise to break exact ties deterministically
    df["_sort_key"] = df[metric_col] + rng.uniform(0, 1e-6, len(df))
    df = df.sort_values("_sort_key", ascending=False).reset_index(drop=True)
    df["arm"] = np.where(df.index % 2 == 0, "treatment", "control")
    df = df.drop(columns=["_sort_key"])
    return df

# Example usage
clusters = pd.DataFrame({
    "url_pattern": [f"/category/{i}/" for i in range(40)],
    "clicks_p90d": np.random.randint(200, 5000, 40)
})
assigned = stratified_cluster_assign(clusters)
print(assigned.groupby("arm")["clicks_p90d"].describe())
See also: [Internal: Internal Link Architecture for Large Crawl Budgets] — internal linking changes are a common experiment type that benefits from this exact cluster design.
CausalImpact Walkthrough: Python & R
Google's CausalImpact library implements a Bayesian structural time-series (BSTS) model. It requires a response time series (treatment group) and one or more covariate time series (control group or exogenous signals) observed over a pre-intervention and post-intervention period. The model learns the relationship between response and covariates in the pre-period, then extrapolates what the response would have been absent the intervention.
Python implementation (using the causalimpact PyPI package, a Python port of the R original):
import pandas as pd
from causalimpact import CausalImpact

# Load GSC data: daily clicks for treatment and control clusters
# Assumed pre-processed from BigQuery (see SQL section below)
df = pd.read_csv("/data/gsc_experiment_clusters.csv", parse_dates=["date"])
df = df.set_index("date").sort_index()

# df columns: treatment_clicks, control_clicks
# Intervention date: 2026-03-10
pre_period  = ["2026-01-01", "2026-03-09"]
post_period = ["2026-03-10", "2026-04-20"]

ci = CausalImpact(df, pre_period, post_period,
                  model_args={"niter": 2000, "standardize_data": True})
ci.run()
print(ci.summary())
ci.plot()
# Key outputs:
#   Absolute effect: point estimate + 95% credible interval
#   Relative effect: percentage lift
#   Posterior probability that effect > 0
R implementation (the canonical Google package):
library(CausalImpact)
library(zoo)

# Load data: zoo time-series object with treatment in col 1, covariates after
gsc_data <- read.csv("/data/gsc_experiment_clusters.csv")
gsc_data$date <- as.Date(gsc_data$date)
ts_data <- zoo(gsc_data[, c("treatment_clicks", "control_clicks")],
               order.by = gsc_data$date)

pre.period  <- as.Date(c("2026-01-01", "2026-03-09"))
post.period <- as.Date(c("2026-03-10", "2026-04-20"))

impact <- CausalImpact(ts_data, pre.period, post.period,
                       model.args = list(niter = 5000,
                                         nseasons = 7,
                                         season.duration = 1))
summary(impact)
plot(impact)

# Extracting the posterior samples for custom reporting
posterior_effect <- impact$series$point.effect
cat("Mean absolute effect:", mean(posterior_effect, na.rm = TRUE), "\n")
cat("95% CI:", quantile(posterior_effect, c(0.025, 0.975), na.rm = TRUE), "\n")
Two calibration checks are mandatory before trusting CausalImpact output. First, run a placebo test: pretend the intervention occurred two weeks before it actually did and verify that CausalImpact finds no effect in that window. Second, inspect the model's one-step-ahead prediction errors in the pre-period; if MAPE exceeds ~20%, the synthetic control is too weak to support inference and you need additional covariates (e.g., overall site impressions, competitor clicks from third-party data).
BigQuery SQL for Google Search Console Data
Google Search Console exports to BigQuery via the Looker Studio connector or the [Internal: GSC → BigQuery data pipeline setup] approach. Once raw impression/click data is in BigQuery, the following query constructs the daily treatment-vs-control aggregated series needed for CausalImpact:
-- BigQuery SQL: Aggregate GSC clicks by experiment arm and date
-- Assumes: project.dataset.gsc_searchdata_site_impression (standard export schema)
-- and: project.dataset.experiment_url_assignments (arm mapping table)

WITH
  arm_mapping AS (
    SELECT
      url_pattern,
      arm  -- 'treatment' or 'control'
    FROM project.dataset.experiment_url_assignments
  ),

  gsc_with_arm AS (
    SELECT
      DATE(data_date)                        AS date,
      g.clicks,
      g.impressions,
      a.arm
    FROM project.dataset.gsc_searchdata_site_impression g
    INNER JOIN arm_mapping a
      ON REGEXP_CONTAINS(g.url, CONCAT('^https://example.com', a.url_pattern))
    WHERE
      DATE(data_date) BETWEEN '2026-01-01' AND '2026-04-20'
      AND g.search_type = 'web'
  ),

  daily_by_arm AS (
    SELECT
      date,
      arm,
      SUM(clicks)      AS total_clicks,
      SUM(impressions) AS total_impressions,
      SAFE_DIVIDE(SUM(clicks), SUM(impressions)) AS ctr
    FROM gsc_with_arm
    GROUP BY date, arm
  )

SELECT
  date,
  MAX(IF(arm = 'treatment', total_clicks, NULL)) AS treatment_clicks,
  MAX(IF(arm = 'control',   total_clicks, NULL)) AS control_clicks,
  MAX(IF(arm = 'treatment', total_impressions, NULL)) AS treatment_impressions,
  MAX(IF(arm = 'control',   total_impressions, NULL)) AS control_impressions,
  MAX(IF(arm = 'treatment', ctr, NULL)) AS treatment_ctr,
  MAX(IF(arm = 'control',   ctr, NULL)) AS control_ctr
FROM daily_by_arm
GROUP BY date
ORDER BY date;
Export this query result as a CSV and feed it directly to the Python or R CausalImpact pipeline above. Note that GSC data has a ~3-day reporting lag; do not interpret the most recent three days of post-period data as stable signal.
Power Calculations Before You Launch
Running an underpowered experiment is arguably worse than running no experiment: it produces a non-significant result that stakeholders misread as "the change does nothing," when the reality is "we couldn't detect the change even if it existed." Standard guidance is 80% power at α = 0.05, but in SEO contexts — where the cost of a false positive (shipping a change that harms rankings) is asymmetric to the cost of a false negative — consider targeting 90% power at α = 0.01.
Minimum Detectable Effect (MDE) calculation for a two-sample proportion test (CTR as the primary metric):
from statsmodels.stats.power import NormalIndPower
import numpy as np

def seo_mde_calculator(baseline_ctr: float,
                        n_treatment_urls: int,
                        avg_impressions_per_url: float,
                        alpha: float = 0.01,
                        power: float = 0.90) -> dict:
    """
    Computes the MDE for a CTR-based SEO experiment.

    Args:
        baseline_ctr: Observed CTR in the pre-period (0 to 1).
        n_treatment_urls: Number of URLs in the treatment cluster.
        avg_impressions_per_url: Mean daily impressions per URL over test window.
        alpha: Significance level (two-tailed).
        power: Desired statistical power.
    Returns:
        Dict with MDE in absolute and relative terms.
    """
    n_obs = n_treatment_urls * avg_impressions_per_url
    analysis = NormalIndPower()
    # Effect size in terms of proportions (Cohen's h approximation)
    # We iterate to find the proportion difference that achieves target power
    from scipy.stats import norm
    z_alpha = norm.ppf(1 - alpha / 2)
    z_beta  = norm.ppf(power)
    p = baseline_ctr
    # Pooled SE for two equal-sized groups
    mde_abs = (z_alpha + z_beta) * np.sqrt(2 * p * (1 - p) / n_obs)
    return {
        "baseline_ctr": round(p, 4),
        "n_observations": int(n_obs),
        "mde_absolute": round(mde_abs, 5),
        "mde_relative_pct": round(100 * mde_abs / p, 2),
        "alpha": alpha,
        "power": power,
    }

result = seo_mde_calculator(
    baseline_ctr=0.032,
    n_treatment_urls=800,
    avg_impressions_per_url=15,
    alpha=0.01,
    power=0.90
)
print(result)
# Example output:
# {'baseline_ctr': 0.032, 'n_observations': 12000,
#  'mde_absolute': 0.00612, 'mde_relative_pct': 19.13,
#  'alpha': 0.01, 'power': 0.9}
If your MDE is 19%, you will only detect changes of that magnitude or larger. If your hypothesis is that a title-tag reformulation drives a 5% CTR improvement, this experiment is dramatically underpowered and you need either more URLs, longer run time, or a looser significance threshold — with full awareness of the tradeoffs. SearchPilot publishes a power calculator tool calibrated to their historical GSC variance estimates, which is worth consulting for template-scale experiments.
Tooling Landscape: SearchPilot, Conductor, DIY
SearchPilot remains the gold standard for managed SEO experimentation in 2026. Its CDN-proxy architecture guarantees that Googlebot sees the intended variant without any CMS involvement, and the platform's built-in statistical layer runs a proprietary time-series model on every active experiment. The limitation is price and flexibility: SearchPilot is most cost-effective for large e-commerce and publisher templates, and its variant delivery is constrained to what a CDN edge layer can modify (title tags, meta descriptions, on-page text, structured data — but not full JavaScript-rendered content without additional configuration).
Conductor's experimentation module targets content marketing organizations. It integrates tightly with the Conductor workflow layer (content briefs, approval chains) and provides experiment analytics within the same interface as keyword tracking. Its statistical methodology is less transparent than SearchPilot's, which matters for organizations that want to audit the analysis pipeline.
DIY approaches — using feature flags in a CDN (Cloudflare Workers, Fastly Compute) to route Googlebot by User-Agent and constructing analysis pipelines on top of BigQuery + CausalImpact — are viable for engineering-mature organizations. The upfront cost is higher, but the flexibility is unlimited: you can test JavaScript rendering changes, Core Web Vitals optimizations, internal linking graph modifications, and schema rollouts with the same infrastructure.
A note on cloaking risk: any bot-detection-based variant delivery walks the line of Google's cloaking policies. SearchPilot has explicit documentation of its methodology that Google's spam team has reviewed. For DIY implementations, consult [External: Google Search Central documentation on URL structure and crawling] and ensure your variant delivery is not serving meaningfully different content to users vs. Googlebot — the experiment should represent a genuine candidate change you would ship to users if it wins.
Methodology Decision Table
Use this table to select the appropriate experimental methodology based on your site's constraints and the nature of the change you want to test.
| Scenario | Recommended Method | Minimum URL Count | Minimum Pre-Period | Primary Metric | Key Risk |
|---|---|---|---|---|---|
| Title tag template change (large e-commerce category) | Cluster RCT + CausalImpact (time-series) | 500 per arm | 8 weeks | Clicks (GSC) | Seasonal confounding; ensure pre-period spans same season |
| Schema markup rollout (product pages) | Cluster RCT + difference-in-differences | 300 per arm | 6 weeks | Rich result impressions | Google's schema validation delay (~2 weeks) inflates Type II errors |
| Core Web Vitals optimization (LCP improvement) | Synthetic control (Causal Impact with CrUX covariate) | Single template | 12 weeks | Average position + clicks | CrUX aggregation lag; field data takes 28 days to stabilize |
| Internal link architecture change | Cluster RCT (silo-level) + crawl depth monitoring | 200 target URLs | 4 weeks | Clicks to affected pages | PageRank redistribution spills across cluster boundaries |
| Meta description update (single-site publisher) | Bayesian A/B (small N); interpret with wide credible intervals | 100 per arm | 4 weeks | CTR | Very low power; treat as directional signal only |
| Canonical tag restructure | Before/after with synthetic control (cannot randomize canonicals) | N/A (site-wide) | 8 weeks | Indexed URL count + impressions | No true control arm possible; high confounding risk |
| Content freshness update (news/evergreen) | Matched-pairs cluster RCT | 50 matched pairs | 6 weeks | Clicks + average position | Query-set drift; match on topic cluster, not just traffic volume |
Protecting Rankings During a Test
The most common objection to SEO experimentation is that a losing variant could damage rankings before the experiment is stopped. This concern is legitimate, and the mitigation is a pre-specified sequential monitoring plan — not continuous peeking, which inflates Type I error, but scheduled interim analyses with pre-specified stopping rules.
Standard practice at SearchPilot is to flag experiments for manual review when the posterior probability of a negative effect exceeds 85% for two consecutive weeks. This is analogous to a Data Safety Monitoring Board rule in a clinical trial. Implement the equivalent in your DIY pipeline:
def interim_monitoring_rule(ci_posterior_neg_prob: float,
                             consecutive_weeks_triggered: int,
                             threshold_prob: float = 0.85,
                             consecutive_threshold: int = 2) -> str:
    """
    Applies a sequential monitoring stopping rule.

    Returns:
        'STOP_NEGATIVE'  -- stop and roll back
        'STOP_POSITIVE'  -- stop and ship
        'CONTINUE'       -- keep running
    """
    if (ci_posterior_neg_prob >= threshold_prob and
            consecutive_weeks_triggered >= consecutive_threshold):
        return "STOP_NEGATIVE"
    # Posterior probability of positive effect > 97.5% for 2 consecutive weeks
    pos_prob = 1.0 - ci_posterior_neg_prob
    if pos_prob >= 0.975 and consecutive_weeks_triggered >= consecutive_threshold:
        return "STOP_POSITIVE"
    return "CONTINUE"
Additionally, establish a ranking sentinel: a set of 20–50 high-value monitored queries associated with the template under test. Track their position daily via GSC or a rank tracker. If any sentinel query drops more than 5 positions and stays there for 7+ days after intervention, trigger a manual review regardless of the statistical monitoring rule. Algorithmic signals and statistical signals can diverge, and the sentinel gives you an early qualitative warning.
Related: [Internal: Core Web Vitals monitoring setup for experiment safety]
Frequently Asked Questions
Is Google's search algorithm stable enough for meaningful SEO A/B testing?
Not always, and that is precisely why time-series causal inference methods like CausalImpact are superior to simple before/after comparisons. By modeling the control group's behavior through the same period, CausalImpact implicitly adjusts for algorithm updates that affect both treatment and control uniformly. The model breaks down only when an update is highly selective — affecting, for example, only the product template you're testing and not similar templates. This is why pre-period parallel trend validation is non-negotiable: if treatment and control diverged before you launched, the synthetic control assumption is already violated.
How does SearchPilot differ from a standard CDN-level feature flag?
SearchPilot's differentiation is threefold. First, it has a documented methodology that explicitly addresses Google's cloaking guidelines — the platform serves the same variant to Googlebot and users when in "bot-only" test mode, ensuring the experiment represents a real candidate change. Second, its statistical layer is calibrated to the specific variance properties of GSC data, including day-of-week effects and impression volatility. Third, it provides pre-built reporting that meets the evidentiary standard most enterprise stakeholders require before authorizing a full rollout. A home-built CDN flag solution can replicate this, but requires significant engineering investment to match the calibration and auditability.
Can I run an SEO experiment on a site with fewer than 100,000 monthly organic clicks?
Yes, but with significant caveats. Power calculations will typically show that you can only detect very large effects (relative CTR changes of 25%+, or position changes of 3+ ranks) with adequate confidence. For smaller sites, the pragmatic recommendation is to use Bayesian analysis with explicitly informative priors (based on industry benchmarks or prior experiments) and to treat results as directional evidence rather than definitive proof. Publishing a change that has a 70% posterior probability of being positive is a reasonable business decision; claiming 95% confidence when the data do not support it is not.
What is the difference between an SEO A/B test and a multivariate SEO test?
An SEO A/B test compares exactly two variants of a single element (e.g., two title tag formulations) across two URL clusters. A multivariate SEO test simultaneously varies multiple elements (e.g., title tag format, H1 structure, and schema type) across multiple clusters. The problem with multivariate SEO testing is that the number of URL clusters required to achieve adequate power grows multiplicatively with the number of variants and elements. In practice, most sites do not have sufficient URL inventory to run a properly powered 2x2 multivariate design on a single template. Sequential A/B testing (test one element at a time, then the next) is almost always the appropriate strategy.
How do I handle Google's index lag when measuring experiment results?
Google's index lag is one of the primary sources of variance inflation in SEO experiments. For large sites, Googlebot may take 2–6 weeks to recrawl and reindex a full template at scale. The practical mitigation has two parts. First, use Google Search Console's URL Inspection API to sample-check that treatment URLs have been indexed with the new variant before including post-period data in the analysis. Second, extend your post-period to at least 4 weeks post-launch and weight the analysis toward the later weeks, where the treatment is more fully rolled out. CausalImpact's time-varying treatment effect outputs are useful here: you can inspect whether the estimated effect grows over time (consistent with gradual reindexing) or is flat (suggesting the signal is noise).
Should I use clicks or average position as my primary metric?
Clicks are almost always the better primary metric for SEO experiments. Average position in GSC is a query-weighted mean that is sensitive to the mix of queries matching each URL cluster, not just ranking changes. A position improvement can be masked by impression growth (more impressions at lower positions can decrease average position arithmetically). Clicks are closer to the business outcome you care about, they aggregate cleanly across queries, and they have better-understood variance properties for modeling. Use position as a diagnostic secondary metric to understand the mechanism of a click effect, not as the primary outcome.
What is a safe experiment duration, and when should I stop early?
A safe minimum duration is 4 weeks post full-deployment (where "full deployment" means ≥90% of treatment URLs have been recrawled). A safe maximum is 12 weeks — beyond this, the control group's synthetic control assumption degrades as exogenous market factors accumulate. Stop early only if your pre-specified sequential monitoring rule triggers (see the Protecting Rankings section) or if a manual quality review of the ranking sentinel reveals a systematic ranking collapse in treatment URLs. Do not stop early because the results look promising — this is the same peeking problem that invalidates frequentist A/B tests in conversion rate optimization.
Key Takeaways
- Before/after comparisons without a counterfactual are not causal evidence. Every SEO experiment needs a control arm or a synthetic control time series.
- Cluster-randomized design at the template level is the correct unit of analysis for SEO experiments. Page-level randomization within a template risks inconsistency signals to Googlebot.
- CausalImpact (available in both Python and R) provides a principled Bayesian time-series framework that adjusts for algorithm update noise and seasonality, outperforming raw t-tests on GSC data.
- Power calculations are mandatory before launch. An underpowered experiment that fails to detect a real effect causes more strategic harm than running no experiment.
- BigQuery + GSC data pipeline is the backbone of a DIY experimentation stack. The SQL patterns in this article produce the treatment/control daily series that CausalImpact requires directly.
- Sequential monitoring with pre-specified stopping rules protects rankings from a sustained losing variant without introducing the peeking problem.
- SearchPilot is the most mature managed platform for template-level experimentation; DIY CDN-based approaches offer more flexibility but require significant engineering and statistical infrastructure investment.
- Clicks are the correct primary metric. Average position is diagnostic only.
Conclusion
SEO experimentation has matured from a niche practice championed by a handful of technical consultants into a systematic capability that enterprise organizations are expected to maintain. The tooling has improved dramatically — SearchPilot's managed platform, Google's open-source CausalImpact library, and BigQuery's GSC integration together form a credible experimental infrastructure that did not exist five years ago.
What has not changed is the fundamental discipline required to produce trustworthy results: careful randomization design, honest power calculations, principled analysis methods, and rigorous stopping rules. The organizations that will compound their SEO advantages in 2026 and beyond are those that treat each experiment as a contribution to a learning system — where each result (positive, negative, or null) updates priors and informs the next test.
The alternative — shipping changes based on intuition, correlation, or underpowered one-off tests — is not neutral. It produces a false sense of understanding that eventually manifests as inexplicable ranking volatility, wasted engineering resources, and lost stakeholder trust. Causal evidence is not a luxury for large-scale SEO programs. It is the minimum viable standard.
For practical next steps, see [Internal: Building an SEO Experimentation Roadmap: Quarterly Planning Template].