Time to First Byte (TTFB) is not a Core Web Vital, but it is the foundation on which every other performance metric is built. A TTFB of 1.5 seconds consumes 60% of the budget needed for Good LCP (2.5 s) before any resource has been fetched. Google explicitly lists TTFB as a diagnostic in PageSpeed Insights and has stated it is a prerequisite for good LCP. This article treats TTFB with the seriousness it deserves: a full technical breakdown of the TTFB components, server-side optimization strategies, CDN configuration, database query impact, edge computing patterns, and field measurement methods.
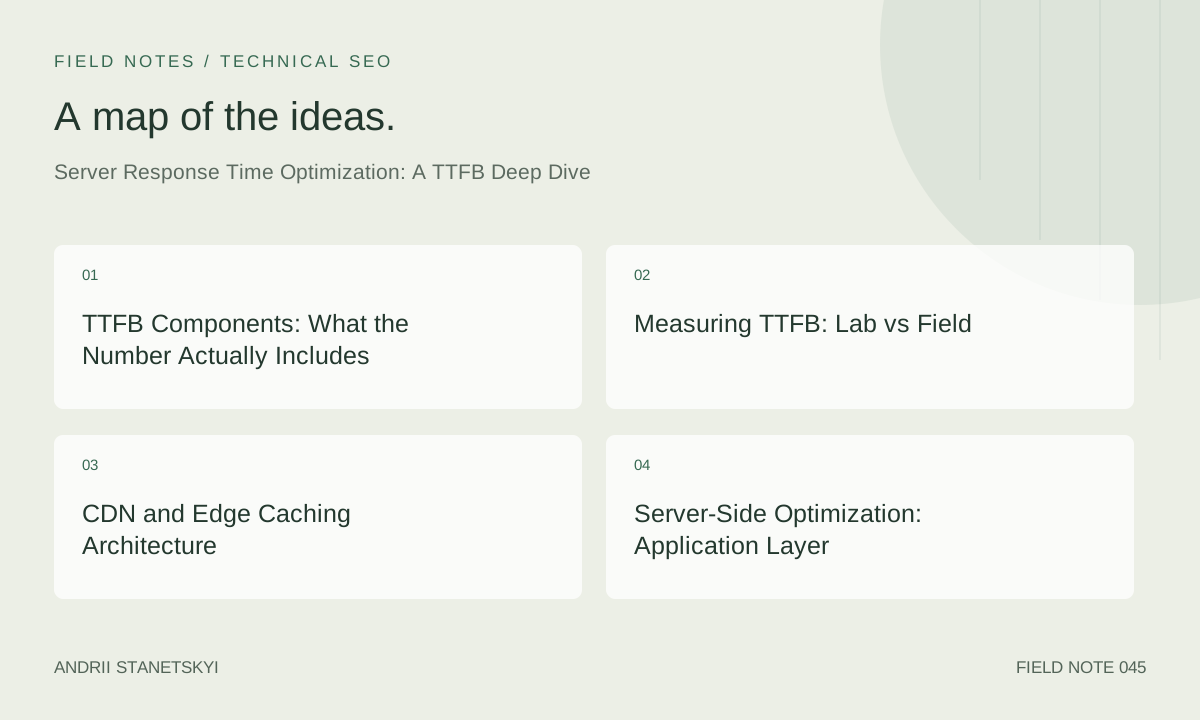
TTFB Components: What the Number Actually Includes
TTFB is measured from the moment the browser starts the navigation request to when it receives the first byte of the response body. This single number contains multiple distinct phases, each requiring different optimization strategies:
| Phase | Measures | Typical Duration | Optimization Layer |
|---|---|---|---|
| DNS Resolution | Domain → IP lookup | 20–200 ms (cold) | DNS TTL, preconnect |
| TCP Connection | Three-way handshake | 1 RTT (20–300 ms) | CDN, HTTP/2, connection reuse |
| TLS Negotiation | Certificate + cipher handshake | 1–2 RTTs | TLS 1.3, session resumption, OCSP stapling |
| Request Time | Request transmission | < 5 ms on fast networks | HTTP/2 multiplexing |
| Server Processing | Application code + DB execution | 10–2000 ms | Application, caching, DB optimization |
Good TTFB target: ≤ 800 ms. Poor: > 1800 ms. These are PageSpeed Insights' diagnostic thresholds (not official CWV thresholds). In the Chrome UX Report, TTFB data is available via the experimental.time_to_first_byte metric.
Measuring TTFB: Lab vs Field
Navigation Timing API
// Measure TTFB from Navigation Timing
const [nav] = performance.getEntriesByType('navigation');
const ttfb = nav.responseStart - nav.startTime;
console.log('TTFB:', ttfb.toFixed(0), 'ms');

// Full breakdown
const dnsTime = nav.domainLookupEnd - nav.domainLookupStart;
const tcpTime = nav.connectEnd - nav.connectStart;
const tlsTime = nav.secureConnectionStart > 0
  ? nav.connectEnd - nav.secureConnectionStart
  : 0;
const serverTime = nav.responseStart - nav.requestStart;

console.log({ dnsTime, tcpTime, tlsTime, serverTime });
web-vitals.js TTFB
import { onTTFB } from 'web-vitals';

onTTFB(({ value, attribution }) => {
  analytics.track('TTFB', {
    value,
    // Sub-breakdowns available in attribution
    waitingDuration: attribution.waitingDuration,
    dnsDuration: attribution.dnsDuration,
    connectionDuration: attribution.connectionDuration,
    requestDuration: attribution.requestDuration,
  });
});
CrUX TTFB via API
// PageSpeed Insights API — get TTFB from CrUX field data
const url = 'https://www.googleapis.com/pagespeedonline/v5/runPagespeed';
const params = new URLSearchParams({
  url: 'https://example.com/',
  strategy: 'mobile',
  key: API_KEY,
  category: 'performance',
});

fetch(${url}?${params})
  .then(r => r.json())
  .then(data => {
    const ttfb = data.loadingExperience?.metrics?.EXPERIMENTAL_TIME_TO_FIRST_BYTE;
    console.log('CrUX TTFB p75:', ttfb?.percentile);
    console.log('Distribution:', ttfb?.distributions);
  });
CDN and Edge Caching Architecture
For most websites, CDN edge caching is the single most effective TTFB optimization. Serving cached HTML from an edge PoP in the user's region reduces TTFB from potentially 500–1500 ms (origin server round-trip) to 20–80 ms (edge cache hit). The challenge is that most pages are dynamic and require server-side logic, making naive full-page caching impossible.
Cache-Control for HTML Documents
# Nginx: HTML pages with stale-while-revalidate
# Users get cached content immediately; CDN refreshes in background
server {
  location / {
    proxy_pass http://app_server;

    # CDN caches for 5 minutes; serves stale for 60s while revalidating
    add_header Cache-Control "public, max-age=300, stale-while-revalidate=60, stale-if-error=86400";

    # Vary on encoding for compressed delivery
    add_header Vary "Accept-Encoding";

    # CDN bypass for authenticated users
    proxy_cache_bypass $cookie_session_id;
    proxy_no_cache $cookie_session_id;
  }
}
Cache Key Segmentation
A common CDN mistake: caching a single HTML version for all users, then finding personalized content shown to the wrong user. Segment cache keys by meaningful dimensions and serve personalization via client-side JavaScript after the cached HTML loads:
# Cloudflare Cache Rules (via Wrangler config)
# Cache based on URL + device type only
# Serve personalization via JS, not HTML

[[rules]]
  expression = 'http.request.method == "GET" && not http.cookie contains "session"'
  action = "set_cache_settings"
  [rules.action_parameters.cache]
    enabled = true
    default_ttl = 300
    browser_ttl = 60
    cache_key.use_device = false  # Serve same HTML to all; CSS handles responsive
    cache_key.exclude_cookie = ["session", "cart_id", "user_id"]
Measuring Cache Hit Rate
# Apache: log cache status with custom header
LogFormat "%h %l %u %t \"%r\" %>s %b \"%{Referer}i\" \"%{User-Agent}i\" %{X-Cache}o" combined_cache
CustomLog /var/log/apache2/access.log combined_cache
Server-Side Optimization: Application Layer
PHP/WordPress: Object Caching
// WordPress: cache expensive database queries in object cache (Redis)
$cache_key = 'homepage_featured_' . get_locale();
$featured_posts = wp_cache_get($cache_key, 'homepage');

if (false === $featured_posts) {
  $featured_posts = new WP_Query([
    'post_type'      => 'post',
    'posts_per_page' => 6,
    'meta_key'       => '_featured',
    'meta_value'     => '1',
    'no_found_rows'  => true, // Skip COUNT(*) query
    'fields'         => 'ids', // Fetch IDs only, hydrate separately
  ]);
  // Cache for 5 minutes
  wp_cache_set($cache_key, $featured_posts, 'homepage', 300);
}
Node.js: Avoid Blocking the Event Loop
// Express: async route handler with proper error boundary
// Wrong: synchronous CPU-intensive work blocks all requests
app.get('/products', (req, res) => {
  const filtered = hugeProductArray.filter(complexFilter); // Blocks event loop
  res.json(filtered);
});

// Correct: use streams or offload to worker threads
const { Worker } = require('worker_threads');

app.get('/products', async (req, res) => {
  try {
    const result = await runInWorker('./product-filter-worker.js', {
      filters: req.query
    });
    res.json(result);
  } catch (err) {
    res.status(500).json({ error: 'Filter failed' });
  }
});

// Even better: cache the result
const cache = new Map();
app.get('/products', async (req, res) => {
  const cacheKey = JSON.stringify(req.query);
  if (cache.has(cacheKey)) {
    res.setHeader('X-Cache', 'HIT');
    return res.json(cache.get(cacheKey));
  }
  const result = await fetchProducts(req.query);
  cache.set(cacheKey, result);
  setTimeout(() => cache.delete(cacheKey), 60_000); // 1-minute TTL
  res.json(result);
});
Database Query Optimization for TTFB
Server processing time is often dominated by database query time. A single un-indexed query on a large table can add 500 ms or more to TTFB. The key is to identify slow queries in production, not in development with small datasets.
Query Analysis with EXPLAIN
-- PostgreSQL: identify slow queries and their execution plans
EXPLAIN (ANALYZE, BUFFERS, FORMAT JSON)
SELECT p.id, p.title, p.price, c.name AS category
FROM products p
JOIN categories c ON c.id = p.category_id
WHERE p.status = 'active'
  AND p.price BETWEEN 10 AND 100
ORDER BY p.created_at DESC
LIMIT 20;

-- Check for Seq Scan (bad) vs Index Scan (good) in output
-- Add index if Seq Scan on large table:
CREATE INDEX CONCURRENTLY idx_products_status_price_created
  ON products (status, price, created_at DESC)
  WHERE status = 'active';
N+1 Query Detection
// Identify N+1 queries in Node with query logging
const { Sequelize } = require('sequelize');
const sequelize = new Sequelize(DATABASE_URL, {
  logging: (sql, timing) => {
    if (timing > 100) {
      console.warn(Slow query (${timing}ms):, sql.substring(0, 200));
    }
  },
  benchmark: true,
});

// Fix N+1: use eager loading instead of lazy loading
// Wrong (N+1):
const products = await Product.findAll();
for (const product of products) {
  const category = await product.getCategory(); // N queries!
}

// Correct (single JOIN):
const products = await Product.findAll({
  include: [{ model: Category }],
});
HTTP Streaming and Early Hints
Server-Sent Early Hints (103)
HTTP 103 Early Hints allows the server to send a preliminary response with resource hints before the main response body is ready. This is valuable for dynamic pages where the server takes 200–800 ms to generate the HTML — the browser can start preconnecting to critical origins and preloading key resources during that server think time.
# Nginx: Send 103 Early Hints before processing dynamic request
location /products {
    # Send hints immediately before proxying to app server
    add_header Link "</critical.css>; rel=preload; as=style" always;
    add_header Link "</hero.avif>; rel=preload; as=image; fetchpriority=high" always;
    add_header Link "<https://fonts.googleapis.com>; rel=preconnect" always;

    # Use lua or OpenResty for true 103 Early Hints
    # Standard nginx: add_before_body for a workaround
    proxy_pass http://app_server;
}
# Caddy: Native 103 Early Hints support
:443 {
  header Link "</styles/critical.css>; rel=preload; as=style"
  header Link "</images/hero.avif>; rel=preload; as=image"
  reverse_proxy localhost:3000 {
    header_up Early-Data {http.request.header.Early-Data}
  }
}
HTTP Response Streaming
For server-rendered pages, streaming the HTML as it's generated allows the browser to start parsing and discovering resources while the server is still generating the rest of the document. This effectively hides server think time behind the browser's parsing work.
// Next.js App Router: streaming with React Suspense
// The shell (header, nav) streams immediately; product data streams when ready
import { Suspense } from 'react';

export default function ProductPage({ params }) {
  return (
    <>
      {/* Streamed immediately — no data dependency */}
      <Header />
      <nav>...</nav>

      {/* Suspense boundary: streams when ProductData resolves */}
      <Suspense fallback={<ProductSkeleton />}>
        <ProductData id={params.id} />
      </Suspense>

      {/* Streamed immediately — no data dependency */}
      <Footer />
    </>
  );
}

// The async Server Component fetches data on the server
async function ProductData({ id }) {
  const product = await db.products.findById(id); // Awaited server-side
  return <ProductDetail product={product} />;
}
Edge Computing Patterns
Edge computing platforms (Cloudflare Workers, Fastly Compute, Deno Deploy) run JavaScript at CDN PoPs worldwide. For TTFB optimization, the pattern is to serve as much as possible from the edge — eliminating the origin round-trip entirely for the majority of users.
// Cloudflare Worker: full-page caching with dynamic personalization
export default {
  async fetch(request, env, ctx) {
    const url = new URL(request.url);
    const cache = caches.default;

    // Generate a cache key without personalization params
    const cacheKey = new Request(url.origin + url.pathname + '?v=' + APP_VERSION);
    let response = await cache.match(cacheKey);

    if (!response) {
      // Origin miss: fetch and cache
      response = await fetch(request);
      if (response.status === 200) {
        const cloned = response.clone();
        ctx.waitUntil(cache.put(cacheKey, cloned)); // Cache asynchronously
      }
    }

    // Add Edge-Cache-Status header for debugging
    const headers = new Headers(response.headers);
    headers.set('X-Edge', response ? 'HIT' : 'MISS');
    headers.set('Server-Timing', edge;desc="Worker",dur=0);

    return new Response(response.body, { headers });
  }
};
TLS and Connection Overhead
TLS 1.3 vs 1.2
TLS 1.3 reduces the handshake from 2 RTTs (TLS 1.2) to 1 RTT, and supports 0-RTT resumption for returning connections. On a 100 ms RTT connection, this saves 100–200 ms from TTFB. Ensure your origin server and CDN both support TLS 1.3 — all major CDNs do by default in 2026.
OCSP Stapling
# Nginx: Enable OCSP Stapling to eliminate the OCSP lookup RTT
ssl_stapling on;
ssl_stapling_verify on;
ssl_trusted_certificate /path/to/chain.pem;
resolver 1.1.1.1 8.8.8.8 valid=300s;
resolver_timeout 5s;
HTTP/2 vs HTTP/3
HTTP/2 multiplexing eliminates head-of-line blocking at the HTTP layer and reuses connections, reducing TLS handshake frequency. HTTP/3 (QUIC) additionally eliminates TCP head-of-line blocking and reduces connection establishment to 1 RTT (0-RTT on resumption). For TTFB specifically, HTTP/3's 0-RTT capability on repeat visits provides a measurable advantage on high-latency connections. See our HTTP/3 guide for detailed configuration.
Before / After: TTFB Improvement Data
| Optimization | TTFB Before | TTFB After | Reduction |
|---|---|---|---|
| Added Cloudflare CDN (HTML caching) | 1,240 ms | 85 ms | -93% |
| Redis object cache for DB queries | 680 ms | 140 ms | -79% |
| TLS 1.3 + OCSP stapling | 320 ms | 210 ms | -34% |
| Added DB index on products table | 480 ms (server) | 45 ms (server) | -91% |
| HTTP/3 (QUIC) on repeat visits | 190 ms | 140 ms | -26% |
| Early Hints (103) for LCP image | LCP 3.2 s | LCP 2.1 s | -34% LCP |
FAQ
Is TTFB a Google ranking factor?
TTFB is not a direct ranking factor, but it is a diagnostic in PageSpeed Insights and a component of LCP (which is a ranking factor as part of Core Web Vitals). Improving TTFB improves LCP almost always proportionally. Google has stated that TTFB above 800 ms makes achieving Good LCP extremely difficult.
How does DNS TTL affect TTFB for returning users?
DNS resolution is cached by the OS and browser. Returning users with warm DNS caches see near-zero DNS time. First-time visitors see the full DNS lookup time. Set your apex and www DNS records with a TTL of 300–3600 seconds. Very low TTLs (60 s) for traffic shifting purposes incur a DNS lookup cost on nearly every visit from ISP resolver caches.
What is stale-while-revalidate and how does it reduce TTFB?
The stale-while-revalidate Cache-Control directive tells CDNs and browsers to serve the cached (possibly stale) response immediately while fetching a fresh version in the background. For HTML pages, this means a cache hit even when the cache is technically expired — TTFB drops to CDN edge latency (20–80 ms) while the origin is revalidated asynchronously, with no user-visible delay.
Does server geographic location matter with a CDN in front?
For cached pages: no — the CDN edge serves from its PoP near the user. For uncached/dynamic pages (cache miss): yes, significantly. A cache miss requires the CDN to fetch from origin, so origin proximity affects the miss latency. Providers like Cloudflare's "Tiered Caching" reduce miss frequency by routing misses to regional CDN nodes rather than all the way to origin.
How do I measure actual server processing time separate from network time?
Use the Server-Timing HTTP response header to expose server-side timings to the browser and tools like WebPageTest:
HTTP/2 200
Server-Timing: db;dur=45;desc="Database", tmpl;dur=12;desc="Template", total;dur=67;desc="Total"
These values appear in Chrome DevTools Network tab → Response Headers and in WebPageTest's timing waterfall. They let you distinguish slow database queries from slow template rendering without SSH access to production logs.
What is the difference between TTFB and FCP for diagnosing server performance?
TTFB measures only to the first byte of the HTML response — it's a pure server/network metric. First Contentful Paint (FCP) measures when the first DOM content is painted, which includes HTML parsing, CSS loading, and initial rendering. A slow TTFB always delays FCP. But fast TTFB with slow FCP indicates the performance bottleneck is in render-blocking resources (CSS, fonts, synchronous JS) rather than server response time.
Key Takeaways
- TTFB > 800 ms makes Good LCP (≤ 2.5 s) nearly impossible — treat it as the floor, not a secondary concern.
- TTFB contains five phases: DNS, TCP, TLS, request transmission, and server processing. Each requires different interventions.
- CDN edge HTML caching is the highest-leverage TTFB optimization for most sites — reducing TTFB from 1,000 ms to under 100 ms on cache hits.
- HTTP 103 Early Hints lets the browser preload critical resources during server think time, effectively parallelizing server processing with browser resource discovery.
- TLS 1.3 saves 1 RTT vs TLS 1.2. Enable OCSP stapling to eliminate the OCSP validation round-trip.
- Server-side processing time is usually dominated by database queries. EXPLAIN ANALYZE on slow queries and add composite indexes for common query patterns.
- Use the
Server-Timingresponse header to expose server sub-timings to DevTools and WebPageTest for production diagnosis.
Conclusion
TTFB optimization is an infrastructure and application discipline, not a frontend one. The toolchain is different — CDN configuration, database indexes, server runtimes, TLS settings — but the payoff flows directly into LCP and therefore into CWV scores and rankings. The sites that achieve consistently Good TTFB (under 800 ms at p75 in CrUX) have invested in CDN architecture, application-layer caching, and database query hygiene as first-class engineering concerns. Combine TTFB optimization with a complete LCP audit using the four-sub-part framework — TTFB is the first lever, and reducing it often makes the downstream optimizations trivially achievable.