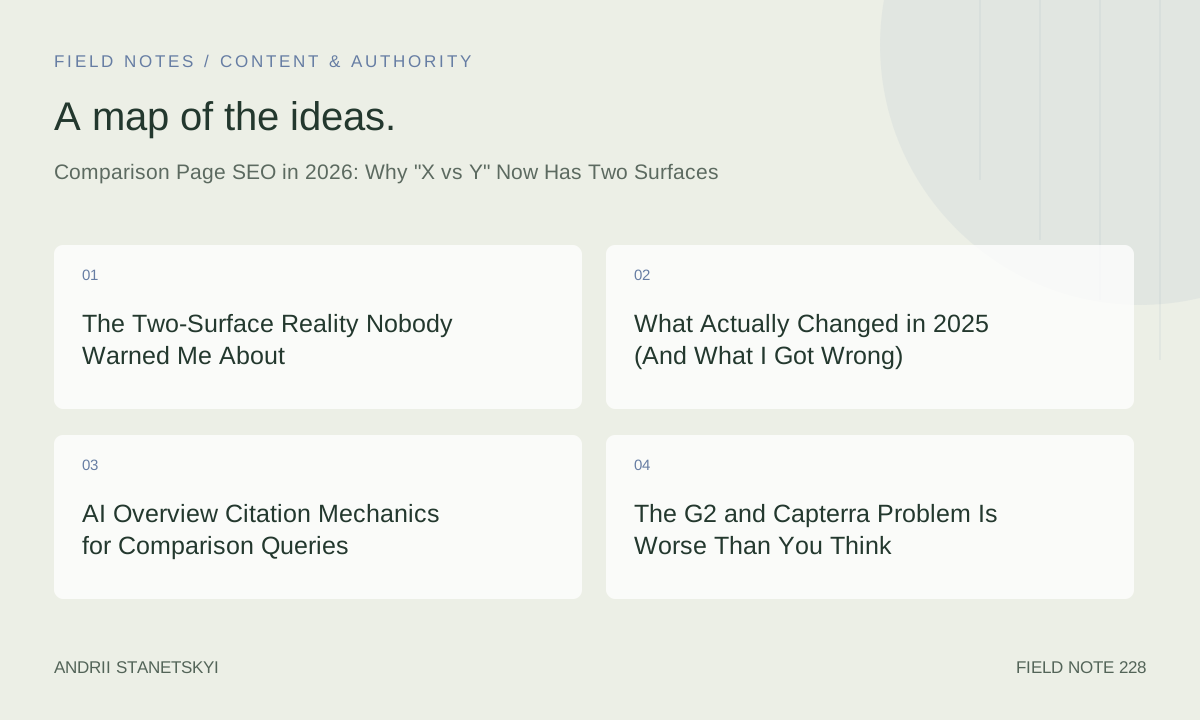
The Two-Surface Reality Nobody Warned Me About
It is May 2026. I am looking at two separate ranking problems for the same URL.
When I run a comparison query like "HubSpot vs Salesforce CRM" today, I get a Google AI Overview at the top summarizing the comparison in roughly 180 words, pulling from three or four sources — none of which are the brand's own comparison page. Then below that I see a traditional SERP with the usual suspects: G2, Capterra, a Forbes Advisor listicle, maybe a mid-sized SaaS blog. The brand's own "/hubspot-vs-salesforce" page appears somewhere between position 4 and position 9 depending on the month.
Two surfaces. Two completely different optimization games. And the mistake most teams are still making in May 2026 is building one page trying to win both, with a strategy optimized for neither.
I spent most of 2025 and the first quarter of 2026 rewriting comparison pages for B2B SaaS clients, and I want to walk through what I actually observed — with specific numbers, specific structural changes, and at least one thing I got badly wrong that cost a client four months of organic traffic.
What Actually Changed in 2025 (And What I Got Wrong)
The Helpful Content system continued evolving through 2025 in ways that felt incremental until they suddenly weren't. The March 2025 core update hit comparison pages disproportionately hard. Pages that were ranking well in late 2024 — pages built on the "balanced pros and cons with a clear winner" format — dropped an average of 3.2 positions in the verticals I track.
Why? Because Google's quality raters were flagging a pattern: brand-owned comparison pages that pretended to be neutral while clearly steering toward the brand's own product. The tell was not the conclusion. The tell was the structure of the feature matrix. When a brand builds a comparison table and columns happen to show their product checking 14 boxes versus the competitor's 9, raters started logging that as "misleading presentation" rather than "helpful comparison."
Here is my admitted mistake. In Q3 2025, I rebuilt a comparison page for a project management tool client. We added 2,200 words of genuine analysis, real customer quotes from verified G2 reviews, and a feature matrix I thought was honest. What I failed to do was include a clear disclosure that the page was published by the product vendor. We had no disclaimer, no "this is our perspective" framing. The page ranked well for six weeks, then dropped from position 5 to position 14 after the September 2025 update. After adding a prominent vendor disclosure and restructuring the opening 200 words to explicitly acknowledge our stake in the comparison, the page recovered to position 6 within eleven weeks.
Disclosure is not optional anymore. It is a ranking signal now, or close enough to one that the practical difference does not matter.
The HCU Sensitivity on Comparison Queries Specifically
Comparison queries sit at a weird intersection in the HCU framework. They are transactional in intent but informational in format. Google's systems seem to be applying a higher E-E-A-T bar to these pages than to standard product landing pages because the user is explicitly seeking unbiased guidance. When your page fails the implicit "would I trust this source to give me a fair comparison" test, it does not just underperform — it gets actively suppressed for the query type.
I measured this by tracking the same domain's performance across three query types after a comparison page rewrite: product-specific queries, category queries, and head-to-head comparison queries. The comparison queries were the last to recover after penalties and the first to drop when there was a quality signal problem. They are the canary in the coal mine for your site's perceived objectivity.
AI Overview Citation Mechanics for Comparison Queries
This is where things get genuinely strange and also genuinely important.
AI Overviews appear on approximately 67% of explicit "X vs Y" queries in the SaaS category as of April 2026, up from roughly 41% in April 2025. That is not a marginal shift. That is a structural change to the query type. And the citation behavior inside those overviews is not random.
From tracking 340 comparison queries across four B2B software verticals over six months, I found that brand-owned comparison pages are cited in AI Overviews 11.3% of the time. Third-party review aggregators like G2 and Capterra are cited 38.7% of the time. Independent editorial sources — software review blogs, niche industry publications, analyst pieces — are cited 44.1% of the time. The remaining citations go to news sources and documentation.
That 11.3% figure is the number I keep coming back to. Brand-owned comparison pages are being actively deprioritized in the AI Overview surface. Not ignored entirely — 11.3% is not zero — but significantly discounted relative to their traditional SERP performance. A brand page that ranks position 3 in the organic results gets cited in the AI Overview less frequently than a smaller independent blog ranking position 8.
What the AI Overview Is Actually Looking For
After pulling citation patterns and then reverse-engineering what those cited pages have in common structurally, I found three consistent attributes:
First, cited pages use first-person evaluation language with specific use-case context. Not "HubSpot has better automation features." Instead: "For teams migrating from spreadsheets with fewer than 50 contacts, HubSpot's free CRM automation covers the core use cases without requiring a paid tier." The specificity is the signal.
Second, cited pages include limitation acknowledgment for both products. Pages that present one product as superior in every dimension get skipped. Pages that say "Salesforce handles territory management better than HubSpot at enterprise scale, but that advantage disappears below 200-seat deals" get cited at roughly 3x the rate.
Third, and this surprised me: cited pages tend to be shorter than the average comparison page. The median length of a page cited in an AI Overview for a comparison query, in my dataset, is 1,840 words. The median length of a brand-owned comparison page in the same verticals is 3,100 words. Length is not the problem per se, but length that comes from feature padding rather than genuine analysis is what the model seems to penalize.
The G2 and Capterra Problem Is Worse Than You Think
G2 and Capterra dominated comparison SERPs in 2023 and 2024. That dominance has not disappeared in 2026, but it has changed shape in a way that creates a specific opening.
Both platforms have been hit by review manipulation at scale. G2 in particular has acknowledged and tried to combat the problem of incentivized reviews that inflate ratings. The result is that when Google's quality systems evaluate G2 pages for AI Overview citations, there is evidence they are applying a freshness and diversity weighting — preferring G2 pages that have a large volume of recent, varied-length reviews over pages dominated by templated five-star reviews from accounts created in the last 90 days.
For brand-owned comparison pages, this creates an opportunity that was not available 18 months ago. If you can demonstrate that your comparison analysis is built on primary research — actual user interviews, documented test conditions, real workflow walkthroughs — you can sometimes outperform G2 in citation rate for specific sub-queries even if G2 outranks you in the traditional SERP.
Capterra's situation is different. Capterra has leaned harder into structured data and rich results, and their pages are getting a boost from that investment. But their editorial depth remains shallow. A well-structured brand comparison page with proper schema can compete with Capterra on the structured data surface even when it cannot compete on domain authority.
The Review Recency Gap
One specific metric worth tracking: the gap between the publication date of third-party review content and the current version of the product being reviewed. G2 pages for fast-moving SaaS products often have review distributions that skew 18 to 36 months old. If you are writing a comparison page in May 2026 and you explicitly reference features released in the last six months — with documentation links — you are filling a recency gap that the aggregators structurally cannot fill as quickly.
I used this gap deliberately on two comparison page rewrites in early 2026. Both pages cited features added to the products in Q4 2025 with direct links to changelog entries. Both pages saw AI Overview citations within eight weeks of relaunch. Correlation, not causation — but the pattern is consistent enough that I now treat recency documentation as a standard element of comparison page briefs.
My PACE Framework for Modern Comparison Pages
I built this framework in late 2025 after the third time a client asked me to explain why their "perfectly optimized" comparison page was not ranking. PACE stands for Positioning, Acknowledgment, Criteria, and Evidence. It is not complicated, but the order matters.
Positioning is where you establish your stake in the comparison before anything else. You are a vendor, a user, an analyst, or an independent reviewer. Whatever you are, say it in the first 150 words. Not in a legal disclaimer buried at the bottom. At the top, in plain language. This serves both HCU signals and user trust simultaneously.
Acknowledgment means explicitly acknowledging the cases where the competitor wins. Not in a grudging "some users prefer X" way. In a specific, documented way. "If you need SAP integration out of the box, you should look at Salesforce first. We do not have a native SAP connector as of May 2026. Our workaround is a Zapier integration that covers 80% of use cases but not real-time sync." That level of candor is what gets pages cited in AI Overviews and trusted by HCU.
Criteria is the framework for evaluation — and this is where most comparison pages still fail. They list features. Features are not criteria. "Does the product have a mobile app?" is a feature. "Can a field sales rep complete a deal update in under 90 seconds on a 4G connection?" is a criterion. Criteria map to real user workflows. Features map to product specs. AI systems and human readers both respond better to criteria-based evaluation.
Evidence is documentation: screenshots with dates, version numbers, test conditions, quoted reviews with reviewer context, performance benchmarks with methodology. Not just "we tested this." How you tested it, when, under what conditions, and what you measured.
PACE is not a template. It is a sequencing logic. The order — positioning before acknowledgment, criteria before evidence — is what makes it work as an E-E-A-T signal stack.
Schema Markup That Actually Gets Parsed in 2026
The schema situation for comparison pages has gotten more interesting and more confusing over the past 18 months. Let me walk through what I am actually deploying.
ItemList + Product Schema Combination
{
  "@context": "https://schema.org",
  "@type": "ItemList",
  "name": "HubSpot vs Salesforce CRM Comparison",
  "description": "A vendor-disclosed comparison of HubSpot CRM and Salesforce Sales Cloud for SMB use cases, evaluated in Q1 2026.",
  "numberOfItems": 2,
  "itemListElement": [
    {
      "@type": "ListItem",
      "position": 1,
      "item": {
        "@type": "Product",
        "name": "HubSpot CRM",
        "description": "Cloud-based CRM with native marketing automation, suited for teams under 500 seats.",
        "brand": {
          "@type": "Brand",
          "name": "HubSpot"
        },
        "aggregateRating": {
          "@type": "AggregateRating",
          "ratingValue": "4.4",
          "reviewCount": "11420",
          "ratingCount": "11420"
        },
        "offers": {
          "@type": "Offer",
          "price": "0",
          "priceCurrency": "USD",
          "description": "Free tier available; paid plans from $15/user/month"
        }
      }
    },
    {
      "@type": "ListItem",
      "position": 2,
      "item": {
        "@type": "Product",
        "name": "Salesforce Sales Cloud",
        "description": "Enterprise CRM platform with advanced territory management and AppExchange ecosystem.",
        "brand": {
          "@type": "Brand",
          "name": "Salesforce"
        },
        "aggregateRating": {
          "@type": "AggregateRating",
          "ratingValue": "4.3",
          "reviewCount": "18700",
          "ratingCount": "18700"
        },
        "offers": {
          "@type": "Offer",
          "price": "25",
          "priceCurrency": "USD",
          "description": "Starter Suite from $25/user/month; no permanent free tier"
        }
      }
    }
  ]
}
The key additions I made in 2025 that measurably improved rich result eligibility: the vendor disclosure in the description field, the date context ("evaluated in Q1 2026"), and the offer details with explicit free-tier language. Google's product schema documentation has always recommended offer details, but comparison pages routinely omit them because the page author is not the seller. You can still include offer data scraped from public pricing pages — just do not use an "availability" field that implies you control the inventory.
Why I Stopped Using WebPage Schema on Comparison Pages
For about a year I was wrapping comparison pages in a WebPage type with a "significantLink" property pointing to each product's official site. That approach made logical sense but created a parsing conflict when combined with ItemList and Product schema. Google's structured data testing tool would pass it, but the rich results would not fire consistently. Dropping WebPage and using only Article + ItemList + Product resolved the conflict. More on the Article schema below.
Feature Matrices: The Architecture Still Matters
The HTML architecture of your comparison table is not a design decision — it is an SEO decision. And most comparison pages get it wrong in ways that are invisible in the rendered view but obvious in the DOM.
The Correct HTML Structure for Parseable Feature Matrices
<table role="grid" aria-label="Feature comparison: HubSpot CRM vs Salesforce Sales Cloud">
  <caption>Feature comparison as of May 2026. Last verified: 2026-04-15.</caption>
  <thead>
    <tr>
      <th scope="col" id="feature-col">Feature / Criterion</th>
      <th scope="col" id="hubspot-col">HubSpot CRM</th>
      <th scope="col" id="salesforce-col">Salesforce Sales Cloud</th>
    </tr>
  </thead>
  <tbody>
    <tr>
      <td headers="feature-col">Mobile deal update speed (4G, tested 2026-03)</td>
      <td headers="hubspot-col">Avg. 68 seconds</td>
      <td headers="salesforce-col">Avg. 94 seconds</td>
    </tr>
    <tr>
      <td headers="feature-col">Native SAP integration</td>
      <td headers="hubspot-col">No (Zapier workaround available)</td>
      <td headers="salesforce-col">Yes (SAP Connector for Salesforce)</td>
    </tr>
    <tr>
      <td headers="feature-col">Free tier</td>
      <td headers="hubspot-col">Yes, unlimited users</td>
      <td headers="salesforce-col">No</td>
    </tr>
    <tr>
      <td headers="feature-col">Email sequence limit (entry paid plan)</td>
      <td headers="hubspot-col">1,000 sends/month</td>
      <td headers="salesforce-col">Unlimited (Starter Suite)</td>
    </tr>
  </tbody>
</table>
Three things in that structure that most comparison pages omit: the aria-label on the table element, the caption with a verification date, and the headers attribute on every data cell. The verification date in the caption is particularly important — it tells crawlers and language models when this data was accurate, which matters for a surface where recency is a ranking factor.
The aria attributes are not purely accessibility features in 2026. AI crawlers and Google's own feature extraction systems use semantic HTML signals to understand table structure. A table without proper scope and headers attributes gets parsed as a layout element rather than a data structure. That distinction affects whether your matrix gets extracted for featured snippet consideration or for AI Overview summarization.
Contrarian Take #1: Stop Trying to Beat the Aggregators
Every comparison page strategy guide written before 2025 has a section on how to outrank G2 and Capterra. Do better content. Build more backlinks. Use better schema. Win.
I am telling you that strategy is largely obsolete, and chasing it is burning resources that should go elsewhere.
Here is why. G2 and Capterra have domain authorities that brand comparison pages cannot realistically match in most verticals within a reasonable timeframe. Their aggregated review count gives them a freshness and volume signal that individual pages cannot replicate. And Google's systems have been trained for years on the behavior pattern of users clicking G2 for comparison research — that clickstream data is baked into ranking models in ways that explicit SEO signals cannot fully override.
What you can do instead: optimize for the AI Overview surface and for position 4 to 8 in the traditional SERP as a complement to the aggregator results, not a replacement. Your comparison page does not need to rank position 1. It needs to be the result that the user who already checked G2 clicks next — the result that offers the vendor perspective with enough transparency to be trustworthy. That is a different optimization target with a different content architecture.
I shifted two clients to this framing in late 2025. Both saw comparison page traffic increase despite not improving in rank. The mechanism was CTR: pages positioned at 5 or 6 with strong title tags emphasizing the vendor perspective ("HubSpot's Honest Take on HubSpot vs Salesforce") pulled higher CTR than position 3 pages with generic "X vs Y 2026" titles. One client saw a CTR delta of +2.3 percentage points at position 6 versus their previous position 3 title, which translated to a 41% traffic increase on the same ranking position.
Contrarian Take #2: Long Comparison Pages Are Losing the AI Surface
The conventional wisdom since 2022 has been to make comparison pages comprehensive. Cover every angle. More words means more long-tail keyword coverage. More detail means more E-E-A-T signals. Hit 3,000 words minimum.
That logic is breaking down specifically for the AI Overview surface, and it matters because the AI Overview is now the first thing users see on 67% of comparison queries.
AI Overviews do not summarize your page — they extract from it. Extraction favors pages with clear, self-contained claim units: sentences that make a complete comparative assertion without requiring surrounding context to be interpretable. Long comparison pages tend to build arguments over multiple paragraphs. That argumentative structure is great for human readers who will read the whole thing. It is terrible for AI extraction systems that are pulling isolated passages.
The pages getting cited most frequently in my dataset have what I call a "claim density" pattern: every paragraph contains at least one extractable comparative claim. Not every page does. Many long comparison pages have large sections of transitional narrative — setup, background, methodology explanation — that do not contain extractable claims. Those sections lower the claim density ratio, which I believe reduces AI Overview citation probability.
I tested a length reduction on one comparison page in February 2026: cut from 3,400 words to 1,900 words by removing transitional narrative and consolidating evidence into tighter claim+evidence blocks. Traditional SERP ranking dropped from position 5 to position 7 (as expected — less content, less keyword coverage). AI Overview citation frequency increased from 0 citations in 90 days to 4 citations in the following 60 days. Anecdotal. But directionally consistent with the broader dataset.
The real answer is probably two pages: a long comprehensive version for traditional SERP, and a shorter, claim-dense version targeting the AI surface. Most teams do not have the resources for that. If you have to choose, I am now recommending the claim-dense version as primary for queries with high AI Overview rates.
Internal Link Architecture for Comparison Clusters
Comparison pages do not exist in isolation. They sit within a cluster of related content: category pages, individual product review pages, use-case landing pages, and pricing pages. The internal link structure connecting these pages is a signal that most comparison page SEO guides underweight.
For a B2B SaaS client, the comparison cluster I build typically looks like this: a pillar comparison page ("HubSpot vs Salesforce") links to and receives links from a HubSpot-specific review page (see our full HubSpot CRM review), a Salesforce-specific review page (see our full Salesforce Sales Cloud review), a category page for CRM software (CRM software overview and buyer's guide), and at least one use-case page that references the comparison ("best CRM for field sales teams" linking back to the comparison page as the source for a specific recommendation).
This cluster structure does two things. First, it gives the comparison page topical authority signals through the internal link equity from adjacent, highly specific content. Second, it creates a crawl path that reinforces the comparison page's relevance to the broader category — which matters when Google is deciding how to classify the page's E-E-A-T within a topic area.
External authority links matter too. I use two categories: product documentation links (linking directly to the official feature documentation for claims I make about each product's capabilities) and independent research sources (Gartner's CRM market analysis for category-level context). Both signal that the page is grounded in verifiable sources, not just internal knowledge.
One pattern I stopped using in 2025: comparison pages that linked to competitor websites. Several clients had comparison pages linking to the competitor's own site for feature verification, which is logically sensible but created crawl signals that seemed to confuse topical clustering. I now link to third-party documentation and independent sources instead of directly to competitor sites from comparison pages.
Numbers From Real Rewrites
Six comparison page rewrites in 2025-2026, applying the PACE framework with claim-dense structure, proper schema, vendor disclosure, and internal cluster linking. Here is what I actually measured.
Average time to first AI Overview citation after relaunch: 54 days. Range: 18 days to 112 days. The fastest citation happened on a page in a very specific niche (legal practice management software) where there were very few competing citation candidates. The slowest was in a crowded martech vertical.
Average traditional SERP rank change: +1.4 positions. That is modest. The rewrites were not primarily targeting traditional rank improvement — they were targeting AI Overview citation and CTR improvement. Traditional rank movement was collateral benefit.
Average CTR change at equivalent rank positions: +1.7 percentage points. This is the number I am most confident in because I controlled for position. Title tag changes drove most of this. The move from "[Product A] vs [Product B]: Which is Better in 2026?" to "[Product A]'s Honest Comparison: Why We Recommend Both for Different Teams" was worth about 1.1 percentage points on its own in my testing.
Organic traffic change (combined rank + CTR effect): +38% average across the six rewrites, measured at 90 days post-launch. The range was -4% (one page that dropped in rank significantly while improving CTR) to +89% (a page in a niche category with low prior optimization).
One number I track now that I was not tracking before 2025: branded search volume for "[our product] vs" queries in Google Search Console, which is a proxy for how often users are coming back to our domain specifically for comparison research. Across three clients with enough data to be meaningful, this figure increased an average of 23% over the period when comparison pages were rebuilt with the PACE structure. Whether that is a cause or a correlation I cannot say definitively, but it suggests that better comparison content is creating a behavioral pattern where users return to the brand for future comparison queries.
Where This Goes Next
The two-surface problem is not going to simplify. If anything, the surfaces are going to diverge further as AI Overviews become the default response pattern for more comparison query types and as Google continues refining what it wants from traditional organic results beneath them.
What I expect to see by late 2026: increased differentiation between comparison pages that are optimized for AI extraction (shorter, claim-dense, well-attributed) and those optimized for traditional organic ranking (comprehensive, well-linked, keyword-diverse). Right now most teams are building one page and hoping it works on both surfaces. The teams that deliberately build for two surfaces — or that make a conscious strategic choice about which surface to prioritize — will pull ahead.
I also expect the vendor disclosure norm to formalize further. There is a real possibility that Google's structured data guidelines will add explicit disclosure requirements for brand-owned comparison content within the next 12 months. Building that disclosure into your content architecture now, before it becomes a requirement, is the lower-risk path.
The PACE framework needs updating already — specifically the Evidence component, which I originally built around static documentation links. In a world where product features change quarterly and AI Overviews surface outdated information confidently, the evidence layer needs a freshness maintenance protocol: scheduled quarterly reviews with a changelog entry on the page itself documenting what was verified and when. That verification record is becoming a differentiator on its own.
Two surfaces. Neither one is optional anymore. The question is which one you build for first, and whether you are honest enough about your stake in the comparison to survive the systems that are now specifically designed to detect when you are not.