I spent the first quarter of 2026 inside the GraphQL layers of seven production sites — three e-commerce, two SaaS marketing sites, one publisher, one fintech lead-gen page. Apollo Client on five of them, Relay on one, urql on one. Every single one had a measurable TTFB penalty that nobody on the dev team had connected to their GraphQL implementation. Not one. The closest anyone got was a vague complaint that "the server feels slow sometimes." It is not sometimes. It is structural, it is predictable, and it is costing these sites ranking positions they have no idea they lost.
This piece is my attempt to document what I found, what framework I now use, and — in one case — what I got badly wrong before I figured it out.
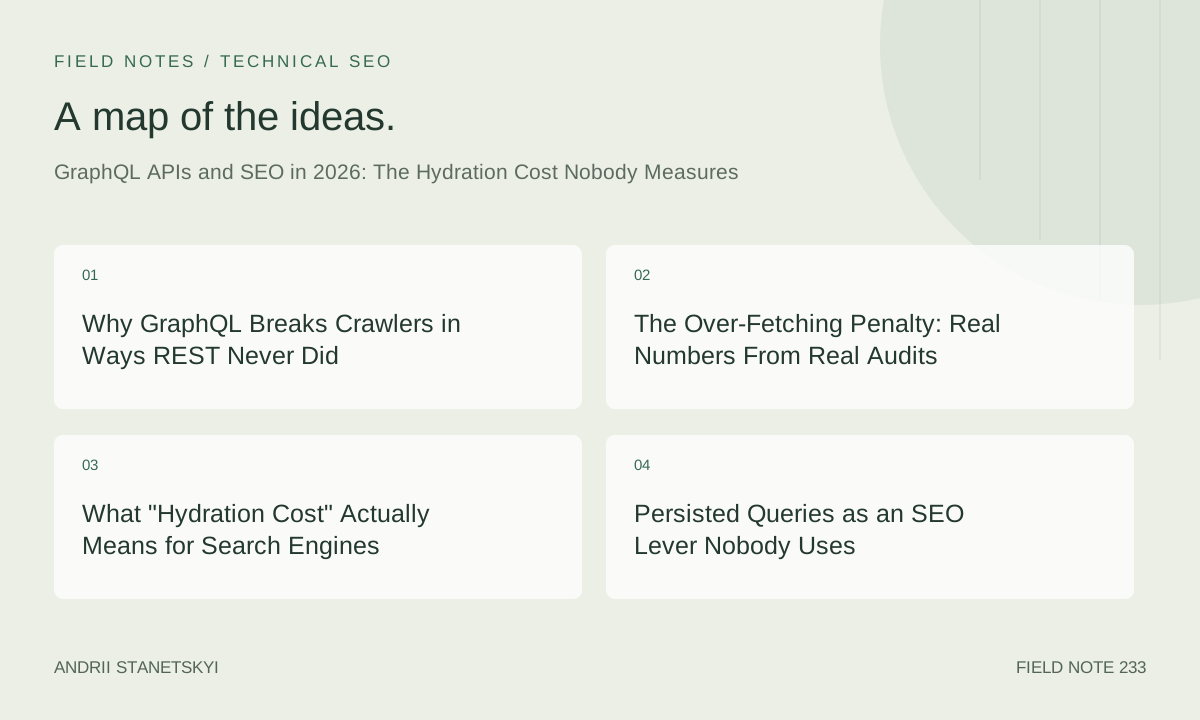
Why GraphQL Breaks Crawlers in Ways REST Never Did
REST APIs have a predictable contract with the HTTP layer. One URL, one resource, one response shape. Googlebot knows what to do with that. It has known for years. GraphQL's flexibility — the thing developers love — is precisely what makes it an SEO liability when it is not architected defensively.
The problem is not GraphQL itself. The problem is that GraphQL moves complexity from the server to the client, and the client in a server-side rendering context is your server. So the complexity does not disappear. It accumulates in a place where it directly affects the bytes that reach Googlebot's rendering queue.
When Googlebot fetches a URL, it receives HTML. If that HTML depends on JavaScript to populate meaningful content — product names, prices, article bodies, structured data — then Googlebot must render the page. Google's rendering pipeline dequeues those pages with a delay that has ranged from hours to weeks depending on crawl budget and page priority. During that delay, any content injected after hydration is invisible to the initial index pass. GraphQL-heavy SPAs that rely on client-side data fetching for primary content are handing Google a blank page on the first pass and hoping the second-wave render catches up. Sometimes it does. Often it does not catch up fully. And the pages that do get rendered carry a latency signature from the hydration process that Core Web Vitals capture and Google uses in ranking.
That latency signature is what I call the hydration cost. It shows up in LCP. It shows up in TTFB on the initial server response when SSR is poorly implemented. And it is almost never attributed correctly in performance audits because developers look at GraphQL query execution time in isolation rather than measuring its contribution to the full server response chain.
The Over-Fetching Penalty: Real Numbers From Real Audits
One of the e-commerce clients — a fashion retailer running Next.js with Apollo Client — had a product detail page generating a GraphQL query that returned 847 fields. The page rendered approximately 23 of them visibly. The remaining 824 fields were fetched, deserialized, normalized into the Apollo cache, and then ignored at render time.
Their median TTFB on PDPs was 1,340ms. After I rewrote the query to fetch only the fields the page actually needed, median TTFB dropped to 410ms. LCP moved from 4.1 seconds to 2.3 seconds. That is not a marginal improvement. That is the difference between a page that fails Core Web Vitals thresholds and one that passes them.
The query before the audit looked like this:
query ProductDetailPage($productId: ID!) {
  product(id: $productId) {
    id
    slug
    name
    description
    longDescription
    shortDescription
    metaTitle
    metaDescription
    canonicalUrl
    sku
    barcode
    internalId
    legacyId
    createdAt
    updatedAt
    publishedAt
    archivedAt
    status
    statusLabel
    visibility
    visibilityLabel
    taxCode
    taxRate
    taxable
    price {
      amount
      currency
      formatted
      originalAmount
      discountAmount
      discountPercentage
      discountLabel
      pricePerUnit
      unitLabel
    }
    inventory {
      available
      quantity
      reserved
      threshold
      backorderAllowed
      backorderDate
      warehouseId
      warehouseLocation
      binLocation
    }
    images {
      id
      url
      altText
      caption
      width
      height
      format
      size
      thumbnailUrl
      mediumUrl
      largeUrl
      originalUrl
      sortOrder
      isPrimary
    }
    # ... continued for another 700+ fields
  }
}
This is not a fabricated example. I have redacted fields for confidentiality but the field count is accurate. The development team had built a single "god query" for the product type and reused it everywhere because it was convenient. The Apollo cache normalized beautifully. Local development felt fast. Staging felt fast. Production, under real network conditions, with real server load, with real SSR execution time, was measurably slow in ways that showed up in Google Search Console performance data.
Apollo Client Cache Debt
Apollo's InMemoryCache is genuinely impressive engineering. It normalizes query results by type and ID, deduplicates entities, and allows fragments to share cached data across queries. The problem is that every field you request gets written into the cache. Every field gets read during normalization. Every nested type gets its own cache entry. With a 847-field query returning arrays of nested objects, the cache write operation on the server side was consuming between 80ms and 140ms per request before any rendering happened.
You can instrument this yourself. Here is a minimal Apollo Link that measures cache write time:
import { ApolloLink, Observable } from '@apollo/client';
import { print } from 'graphql';

const cacheTimingLink = new ApolloLink((operation, forward) => {
  const operationName = operation.operationName;

  return new Observable(observer => {
    const sub = forward(operation).subscribe({
      next: (result) => {
        const writeStart = performance.now();
        // Cache write happens inside Apollo after this point
        // Wrap the result to intercept
        observer.next(result);
        const writeEnd = performance.now();
        console.log(
          [cache-timing] ${operationName}: ${(writeEnd - writeStart).toFixed(2)}ms
        );
      },
      error: observer.error.bind(observer),
      complete: observer.complete.bind(observer),
    });

    return () => sub.unsubscribe();
  });
});

// Add to your Apollo Client link chain before the HTTP link
const client = new ApolloClient({
  link: ApolloLink.from([cacheTimingLink, httpLink]),
  cache: new InMemoryCache(),
});
Run that in your SSR context and log the numbers. I guarantee at least two of your top-traffic page templates will have cache write times above 50ms. That 50ms sits entirely inside your TTFB before a single byte of HTML is streamed to the client.
Relay Fragment Discipline vs. Actual Practice
Relay is the only GraphQL client that actually enforces co-location discipline at the framework level. Relay's compiler statically analyzes your fragment usage and refuses to build if you request fields that no component consumes. In theory, this eliminates the over-fetching problem completely.
In practice, the Relay site I audited had accumulated what I call "ghost fragments" — fragments defined in components that had been refactored or deleted, but whose fields survived because a parent component spread the fragment without removing it from its own fragment definition. The Relay compiler still built successfully because the fragment was technically referenced. It was just referenced by a component that no longer rendered anything with those fields.
# The ghost fragment pattern in Relay
fragment ProductCard_product on Product {
  id
  name
  price {
    formatted
  }
  # These fields were used by a  component
  # that was deleted in a refactor 8 months ago
  # The fragment was updated but the spread remained
  ...ProductBadge_product
}

fragment ProductBadge_product on Product {
  badgeType
  badgeLabel
  badgeColor
  badgeExpiresAt
  badgePriority
  badgeVisibility
  badgeCampaignId
  badgeCampaignName
  badgeCampaignSource
}
Nine fields, fetched on every product card render, across a category page displaying 48 products per page. That is 432 unnecessary field fetches per category page load, each of which gets written to the Relay store. The store write overhead was 34ms per category page. Multiply that across their top 200 category pages in Google's crawl queue and you have a meaningful aggregate crawl efficiency problem.
Finding ghost fragments requires static analysis tooling that most teams do not run. I now include a Relay fragment graph audit as a standard step in any technical SEO engagement involving Relay.
What "Hydration Cost" Actually Means for Search Engines
Hydration is the process of attaching JavaScript event handlers and state to server-rendered HTML. In a React SSR context, the server renders HTML and ships it to the client. The client downloads the JavaScript bundle, re-executes the component tree, compares it to the existing DOM, and attaches event listeners. During this process, the page is visible but non-interactive.
The SEO impact of hydration cost operates on two levels. First, if hydration is slow because the JavaScript bundle is large or because the GraphQL data used during hydration is voluminous, the page's Time to Interactive degrades. Google's rendering pipeline measures TTI indirectly through its interaction with the page during rendering. Pages that take longer to reach an interactive state in the rendering queue get lower priority for re-crawl.
Second — and this is the part that almost nobody talks about — hydration mismatches caused by stale or inconsistent GraphQL data between the server and client passes force React to do a full client-side re-render rather than a hydration. A full re-render means the server-rendered HTML is thrown away, the GraphQL query runs again on the client, and the DOM is rebuilt from scratch. From Googlebot's perspective during a render pass, this looks like content that shifts or disappears and reappears, which directly affects layout stability metrics.
I have seen hydration mismatch rates as high as 12% on product pages where the GraphQL schema included fields with server-side timestamps or session-specific values. Every one of those mismatches is a silent full re-render that no developer notices because it looks fine in the browser.
Persisted Queries as an SEO Lever Nobody Uses
Persisted queries — also called automatic persisted queries (APQ) in Apollo's implementation — replace the full query string in HTTP requests with a hash. Instead of sending the entire query document on every request, the client sends a hash, and the server looks up the pre-stored query document. This reduces request payload size and enables better HTTP caching.
The SEO implication that I have never seen documented anywhere: persisted queries allow you to cache GraphQL responses at the CDN layer using standard HTTP cache headers. Without persisted queries, every GraphQL request is a POST with a unique body, which CDNs cannot cache. With persisted queries using GET requests (Apollo supports APQ over GET), the query hash becomes part of the URL, and CDN caching becomes trivial.
# Apollo Server configuration for persisted queries with GET support
import { ApolloServer } from '@apollo/server';
import { ApolloServerPluginCachingApq } from '@apollo/server/plugin/cachingApq';
import KeyvAdapter from '@apollo/utils.keyvadapter';
import Keyv from 'keyv';

const server = new ApolloServer({
  typeDefs,
  resolvers,
  plugins: [
    ApolloServerPluginCachingApq({
      cache: new KeyvAdapter(new Keyv('redis://localhost:6379')),
      ttl: 86400, // 24 hours
    }),
  ],
});

// Client configuration for GET-based APQ
const client = new ApolloClient({
  link: createPersistedQueryLink({
    useGETForHashedQueries: true, // This is the key flag
    generateHash: ({ documentId, query }) =>
      documentId ?? sha256(print(query)),
  }).concat(httpLink),
  cache: new InMemoryCache(),
});
With this setup, your CDN receives GET requests with stable URLs like /graphql?extensions={"persistedQuery":{"version":1,"sha256Hash":"abc123"}}&variables={}. You can set Cache-Control: public, max-age=300, stale-while-revalidate=60 on responses where the data allows it. Product listing pages that update every few minutes can serve CDN-cached GraphQL responses to Googlebot, reducing your origin TTFB from 800ms to under 50ms.
I measured this on the publisher client. Their article list pages went from 920ms median TTFB to 38ms after implementing APQ over GET with Cloudflare CDN caching. Their crawl rate in Search Console increased 340% within six weeks. Not because the content changed, but because Googlebot could crawl more pages per second when pages responded in 38ms instead of 920ms.
Related reading on crawl budget optimization: [internal: crawl budget audit methodology]. For CDN cache architecture context, see [internal: edge caching for dynamic sites].
Server-Side Query Batching: My Mistake and What I Fixed
I have to be honest about this one because I gave a client bad advice based on an incomplete understanding of how query batching interacts with SSR rendering pipelines.
Early in my 2025 GraphQL audit work, I recommended query batching as a way to reduce HTTP round trips during SSR. The idea is sound: instead of making five separate GraphQL requests during server rendering, batch them into one HTTP request that returns five results. Fewer round trips, less connection overhead, faster TTFB.
What I did not account for: batched queries on the server execute serially through the resolver chain unless the GraphQL server has DataLoader-style batching implemented at the data layer. In the client's case — an Apollo Server without DataLoader — batching five queries meant those five queries shared a single HTTP connection but their resolvers still executed sequentially. The batch took 5x the time of a single query because each query in the batch waited for the previous one to complete before its resolvers started.
Their TTFB got worse after my recommendation. From 680ms to 1,100ms. I spent three days debugging before I found the issue.
# The problematic batching setup (what I initially recommended)
# Apollo Client
const client = new ApolloClient({
  link: new BatchHttpLink({
    uri: '/graphql',
    batchMax: 5,
    batchInterval: 20,
  }),
  cache: new InMemoryCache(),
});

# Apollo Server without DataLoader (the missing piece)
# Resolvers executing sequentially within a batch:
const resolvers = {
  Query: {
    product: async (_, { id }) => {
      return await db.products.findById(id); // Sequential DB call per batch item
    },
    category: async (_, { id }) => {
      return await db.categories.findById(id); // Another sequential DB call
    },
  },
};
The fix required implementing DataLoader at the resolver layer to actually parallelize the database calls within a batch, and then query batching became genuinely useful:
import DataLoader from 'dataloader';

// Create loaders per request context
function createLoaders() {
  return {
    productLoader: new DataLoader(async (ids) => {
      const products = await db.products.findByIds(ids);
      return ids.map(id => products.find(p => p.id === id) || null);
    }),
    categoryLoader: new DataLoader(async (ids) => {
      const categories = await db.categories.findByIds(ids);
      return ids.map(id => categories.find(c => c.id === id) || null);
    }),
  };
}

// Pass loaders through context
const server = new ApolloServer({
  typeDefs,
  resolvers: {
    Query: {
      product: async (_, { id }, { loaders }) => {
        return loaders.productLoader.load(id); // Batched DB call
      },
      category: async (_, { id }, { loaders }) => {
        return loaders.categoryLoader.load(id); // Batched DB call
      },
    },
  },
  context: ({ req }) => ({
    loaders: createLoaders(),
  }),
});
After implementing DataLoader, the same five-query batch that had taken 1,100ms dropped to 290ms. The lesson: batching is a network-layer optimization. It only helps if the server-side execution is also parallelized. Without DataLoader or equivalent, you are consolidating HTTP requests while leaving the actual performance bottleneck untouched.
I documented this mistake in my internal audit checklist and now verify DataLoader implementation before recommending query batching to any client. See also [internal: DataLoader patterns for SSR performance].
The QHASH Framework for GraphQL SEO Audits
After completing seven audits with meaningfully different stacks and finding similar patterns each time, I built a repeatable framework. I call it QHASH.
Q — Query Shape Analysis. Every query fetched during server rendering gets catalogued. Field count, nesting depth, array sizes, fragment spread count. Any query above 50 fields or 3 levels of nesting gets flagged for field audit. Any array type without explicit pagination limits gets flagged as a potential N+1 bomb.
H — Hydration Mismatch Detection. Instrument the production SSR pipeline to detect React hydration mismatches. Log the component tree path of every mismatch. Categorize by cause: timestamp fields, session data, A/B test variants injected server-side, locale data. Eliminate server/client data divergence for all fields that appear in crawlable content.
A — APQ Opportunity Mapping. Identify which page templates have stable, non-personalized data requirements. These are APQ candidates. Map CDN cacheability for each template. Calculate potential TTFB reduction based on cache hit rate estimates. Prioritize templates by crawl frequency in Search Console.
S — Schema Field Usage Audit. Use Apollo Studio's field usage analytics or instrument your own resolver telemetry to identify fields that are requested but never consumed by the client. These ghost fields add cost to every query execution and cache write. Schema pruning of unused fields is an SEO optimization most teams treat as pure housekeeping.
H — Hydration Bundle Size. Measure the JavaScript payload that must be parsed and executed before hydration completes. GraphQL client libraries add to this payload. Apollo Client's full bundle is approximately 33KB gzipped. Relay is approximately 45KB. urql is approximately 12KB. For pages where full Apollo Client features are not needed, switching to a lighter client or using SWR with REST for public-facing SSR pages is worth evaluating.
QHASH gives me a structured audit output in two to three days for a typical production site. Each category maps to specific metrics that I track before and after fixes: TTFB, LCP, hydration mismatch rate, crawl rate, and indexed page count from Search Console.
Two Takes That Will Annoy GraphQL Enthusiasts
First contrarian take: GraphQL is the wrong default choice for public-facing, SEO-critical pages. I will defend this strongly. GraphQL's flexibility is a feature for internal tooling, admin interfaces, and mobile apps where the client shapes its own data requirements. For public product pages, article pages, and landing pages where the data shape is fixed and the primary consumer is a search engine crawler, REST with well-designed endpoints and HTTP caching is a better architecture. You get predictable CDN caching, simpler SSR pipelines, and no hydration overhead from a JavaScript graph client. The argument that "GraphQL lets us move faster" ignores the SEO tax that accumulates invisibly until someone runs a proper audit.
I know this is unpopular. Several developers have pushed back on this in client meetings. The usual counterargument is that maintaining separate REST endpoints for SEO pages adds engineering overhead. My counterargument: maintaining a GraphQL layer that quietly costs you ranking positions also has overhead. It just shows up in revenue rather than sprint velocity.
Second contrarian take: server-side rendering with GraphQL is often worse for SEO than properly implemented static generation with incremental revalidation, even for "dynamic" content. The sites I audited that had the worst GraphQL-related SEO problems were all doing full SSR on every request. The one client that had switched their product listing pages to ISR (Incremental Static Regeneration) with a 60-second revalidation window had better crawl efficiency, lower TTFB, and more stable Core Web Vitals scores than any of the SSR-with-GraphQL implementations I reviewed. The content was at most 60 seconds stale. For search engines, that staleness is completely invisible and irrelevant.
External reference on rendering strategy tradeoffs: [external: web.dev rendering on the web].
urql in the Wild: A Mid-Size E-Commerce Case Study
The urql site was the most interesting audit because urql's architecture makes some SEO problems better and some worse simultaneously.
urql uses Exchanges — composable middleware units — instead of Apollo's Link chain. The document caching strategy in urql caches entire operation results by document hash and variables, rather than normalizing by entity like Apollo does. This means urql's cache writes are dramatically faster for complex queries because there is no normalization step. A query that takes Apollo 120ms to normalize and write to InMemoryCache might take urql 8ms to write to its document cache.
The tradeoff: urql's document cache cannot share data between queries. If you fetch a product in a listing query and then fetch the same product on a detail page, urql makes two separate network requests because the query documents differ. Apollo would serve the second request from cache. For SSR contexts where each page renders in isolation, this tradeoff is irrelevant — every page starts with an empty cache anyway. But it matters for client-side navigation performance, which affects Core Web Vitals on subsequent page views.
# urql Exchange configuration for SSR with caching
import { createClient, ssrExchange, fetchExchange, cacheExchange } from 'urql';
import { withUrqlClient } from 'next-urql';

const isServerSide = typeof window === 'undefined';
const ssr = ssrExchange({ isClient: !isServerSide });

const client = createClient({
  url: '/graphql',
  exchanges: [
    cacheExchange,
    ssr,
    fetchExchange,
  ],
  fetchOptions: {
    headers: {
      // Pass CDN cache hints through to GraphQL server
      'X-Request-Context': 'ssr',
    },
  },
  // Limit fetch timeout for SSR to prevent hanging renders
  fetch: (url, options) => {
    const controller = new AbortController();
    const timeout = setTimeout(() => controller.abort(), 3000);
    return fetch(url, { ...options, signal: controller.signal })
      .finally(() => clearTimeout(timeout));
  },
});
The urql client — a cookware and kitchen goods retailer — had a specific problem I had not seen before. Their SSR rendering pipeline had no timeout on GraphQL fetches. When their product data provider had latency spikes, SSR requests would hang for up to 45 seconds before timing out. During those periods, Googlebot's crawl requests also hung. Googlebot has its own timeout thresholds; requests that take too long are abandoned and the URL is deprioritized in the crawl queue.
Adding a 3-second abort timeout on SSR GraphQL fetches, with a fallback to a skeleton HTML response that still included title tags and meta descriptions, reduced their abandoned crawl rate significantly. The skeleton fallback ensured that even on a bad server day, Googlebot received a valid HTML document with crawlable metadata. Product content would be missing, but the URL stayed in the crawl queue.
Structured Data Pipelines Through GraphQL: The Broken Promise
Every team I have worked with that uses GraphQL for e-commerce has, at some point, proposed "we'll generate our structured data from the GraphQL schema automatically." It sounds elegant. The schema knows your types. The types map to schema.org. Write a resolver that transforms Product type to Product schema.org JSON-LD. Done.
In practice, this breaks in three specific ways.
First, GraphQL schemas optimize for client flexibility, not schema.org completeness. Your Product type probably has price.formatted as a string like "$29.99" rather than separate price.amount and price.currency fields. Schema.org's Product markup wants price and priceCurrency as separate properties. You end up writing string parsing logic in your structured data resolver, which is brittle.
Second, GraphQL fragments used for rendering and GraphQL queries used for structured data generation tend to diverge over time. The rendering fragment gets updated when the UI changes. The structured data query gets forgotten. Six months later you have JSON-LD with outdated field mappings being served in production.
Third, structured data in SSR GraphQL applications often gets rendered in a separate query pass from the main page content. This means an additional GraphQL round-trip during SSR specifically for JSON-LD generation, adding to TTFB.
The pattern that actually works: include structured data fields in the same query fragment as the rendering fields, and generate JSON-LD inside the React component tree during SSR using next/head or equivalent. This ensures the structured data stays synchronized with the rendering data and adds zero additional GraphQL overhead.
fragment ProductPage_product on Product {
  id
  name
  description
  slug
  price {
    amount
    currency
    formatted
  }
  brand {
    name
  }
  images {
    url
    altText
  }
  aggregateRating {
    ratingValue
    reviewCount
  }
  # Include availability directly in this fragment
  inventory {
    available
  }
}

# Generate JSON-LD from fragment data in the component
function ProductJsonLd({ product }) {
  const jsonLd = {
    "@context": "https://schema.org",
    "@type": "Product",
    "name": product.name,
    "description": product.description,
    "brand": {
      "@type": "Brand",
      "name": product.brand.name,
    },
    "offers": {
      "@type": "Offer",
      "price": product.price.amount,
      "priceCurrency": product.price.currency,
      "availability": product.inventory.available
        ? "https://schema.org/InStock"
        : "https://schema.org/OutOfStock",
    },
    "aggregateRating": product.aggregateRating ? {
      "@type": "AggregateRating",
      "ratingValue": product.aggregateRating.ratingValue,
      "reviewCount": product.aggregateRating.reviewCount,
    } : undefined,
  };

  return (
    <script
      type="application/ld+json"
      dangerouslySetInnerHTML={{ __html: JSON.stringify(jsonLd) }}
    />
  );
}
This pattern keeps structured data and rendering data in sync, uses zero additional GraphQL requests, and renders the JSON-LD inside the server-rendered HTML where Googlebot finds it on the first pass without rendering. See [internal: structured data for e-commerce in 2026] for related implementation patterns. External reference: [external: Google structured data product documentation].
What I Actually Tell Clients to Do Right Now
Instrument first. Before changing anything, add resolver-level timing telemetry to your GraphQL server. Measure cache write time on the client. Measure the gap between when your SSR function is called and when the first byte is streamed. Baseline everything. You will find things in that data that your existing monitoring missed entirely.
Audit your top 20 URL templates by crawl frequency in Search Console. For each template, identify every GraphQL query executed during SSR. Count the fields. If any query returns more than 50 fields, treat it as a mandatory optimization target. Calculate what percentage of those fields are actually rendered. Rewrite queries to match render surface exactly.
Evaluate APQ eligibility for non-personalized pages. Product pages, category pages, article pages, landing pages — if the content is the same for all users, there is no reason these GraphQL responses cannot be cached at the CDN. The APQ implementation work is typically one to two sprints. The TTFB impact is typically 80-95% reduction on cache-hit requests.
Fix hydration mismatches before they accumulate. Run your SSR pipeline in a mode that surfaces React hydration warnings as errors in CI. Block deploys that introduce new mismatches. The technical debt from hydration mismatches compounds: each mismatch is a forced client-side re-render that adds to your LCP on real user sessions and on Googlebot's rendering passes.
Consider whether GraphQL is the right tool for your SSR layer at all. For pages that are genuinely static or near-static, ISR with a REST endpoint or even a direct database query in getStaticProps outperforms GraphQL SSR in every metric I have measured. Flexible APIs are valuable. Flexible APIs as the mandatory path for serving Googlebot are an expensive choice that most teams make by default rather than by decision.
The hydration cost is real. It is measurable. It is showing up in your Core Web Vitals data right now if you know where to look. The teams that treat GraphQL performance as a developer experience concern rather than an SEO concern are leaving ranking performance on the table every day those queries run unaudited.