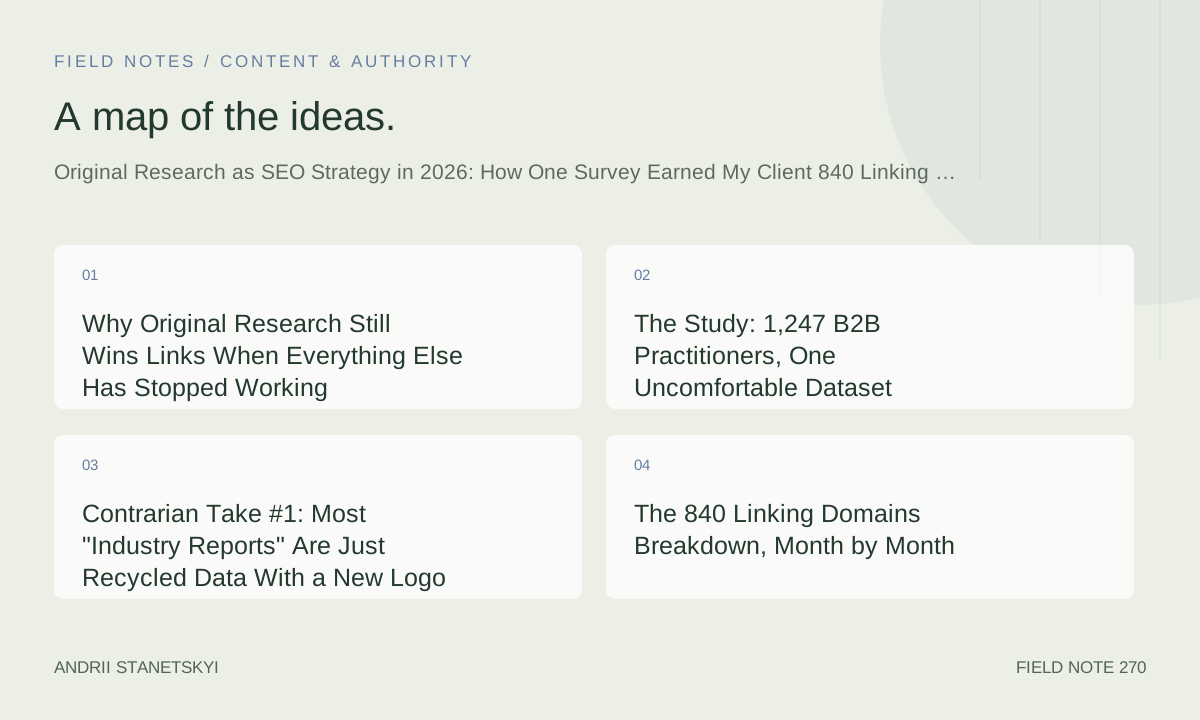
Why Original Research Still Wins Links When Everything Else Has Stopped Working
In January 2025, I sat across from a B2B SaaS client whose domain authority was stalling despite a content team publishing four articles a week. Forty-eight pieces in the preceding quarter. Zero meaningful new referring domains. Their link profile looked like a flat line on a hospital monitor.
I told them to stop publishing for six weeks.
Instead of another "10 Best Practices" post, we would design, field, and publish a single primary research study targeting their exact practitioner audience. The idea felt risky to them. It felt obvious to me. Here's what happened over the next twelve months — and why I think original research isn't just a tactics play anymore. It's the architecture layer beneath everything else that works.
We ended up with 840 linking domains. A cost of $14,000 all-in. A measured ROI of 4.2x over twelve months. And a dataset that competitors literally cannot replicate, because we own it.
But I want to be careful here. I'm not writing a victory lap. I'm writing the full story, including the mistake we made in the first month that delayed our earliest links by three weeks and cost us roughly 60 to 80 placements I'll never be able to confirm we lost.
The Study: 1,247 B2B Practitioners, One Uncomfortable Dataset
The client is a mid-market workflow automation platform. Their audience: operations managers, RevOps leads, and IT directors at companies with 200 to 2,000 employees. A specific, reachable, survey-able population.
We ran the survey in two waves. The first wave hit in October 2024: 847 respondents from a third-party panel provider we vetted carefully (more on methodology below). The second wave ran in January 2025 to fill demographic gaps and test whether Q4 responses showed seasonal skew. Final sample: 1,247 practitioners across North America, UK, and DACH region. Median company size: 540 employees. Survey length: 22 questions. Median completion time: 9 minutes 14 seconds.
What we were measuring: how B2B operations teams actually budget for, evaluate, and abandon workflow automation tools. Not hypothetically. What they actually did in the preceding 18 months.
The top finding — the one that got cited everywhere — was this: 67% of respondents said their automation stack included at least one tool their team had stopped using but still paid for. The median monthly waste was $1,340 per company. That number landed. Industry newsletters, Substacks, LinkedIn posts, podcast episodes. It became the kind of finding that people repeat without necessarily going back to the original source, which tells you it resonated at an emotional level with the audience.
We also found that 41% of automation tool purchases were made without a documented evaluation process. And that only 23% of companies had a formal offboarding process for deprecated tools. Every single one of these numbers was uncomfortable for someone in the ecosystem. Vendors. Consultants. Buyers. That discomfort is a feature, not a problem.
Why Uncomfortable Findings Drive More Links
This is something I've observed across multiple research projects now: findings that make people feel something — especially mild professional embarrassment or recognition — generate more organic sharing than findings that confirm what everyone already believes.
If your data says "most companies could do better at X," you'll get polite acknowledgment. If your data says "67% of you are paying for tools nobody uses," you get sharing. You get quote-tweets. You get newsletter callouts. You get the link.
Design your research questions to surface the gap between what practitioners say they do and what they actually do. That gap is almost always where the linkable data lives.
Contrarian Take #1: Most "Industry Reports" Are Just Recycled Data With a New Logo
Let me say something that will annoy a significant portion of people who work at large content marketing agencies.
The majority of what passes for "original research" in B2B content marketing is not original research. It is third-party data with a fresh coat of brand paint. Someone licenses a Statista dataset, writes some observations, adds their logo, and publishes it as "The State of [Industry] 2025." They may even call it a "report."
This matters for SEO because these pieces still earn links — short-term. But they don't earn the deep, authoritative, editorial links that move the needle on domain-level trust signals. A journalist at a trade publication who is citing numbers in a feature piece is going to cite numbers they can't find anywhere else. She is not going to cite your repackaged Gartner estimate when she can link directly to Gartner.
Primary data — meaning data you collected, from a population you defined, with methodology you controlled — is something no one can replace you as the source for. That's not a content strategy advantage. That's a structural advantage. It compounds differently.
When we published the automation waste study, I specifically tracked which links came from people citing us versus links that came from people citing findings they'd seen cited elsewhere. By month three, we had 34 links from people citing findings that had been mentioned in a major newsletter — without those writers ever visiting our original source page. They linked anyway, because the study was the canonical reference point by that time. That's what happens when you own the data.
The 840 Linking Domains Breakdown, Month by Month
I want to give you the actual growth curve, not a smoothed version of it, because the shape of link acquisition from a research asset is not what most people expect.
| Month | New Referring Domains | Cumulative Total | Primary Driver |
|---|---|---|---|
| Feb 2025 (launch) | 47 | 47 | Direct outreach, seeded newsletter |
| Mar 2025 | 112 | 159 | Trade press pickup, LinkedIn virality |
| Apr 2025 | 89 | 248 | Secondary citations, podcast episodes |
| May 2025 | 61 | 309 | Long-tail blogger coverage |
| Jun 2025 | 44 | 353 | Slow trickle, end-of-H1 roundup pieces |
| Jul 2025 | 28 | 381 | Organic tail |
| Aug 2025 | 31 | 412 | Back-to-work content surge |
| Sep 2025 | 67 | 479 | Q3 planning content, re-seeding campaign |
| Oct 2025 | 93 | 572 | Annual planning season, new outreach wave |
| Nov 2025 | 118 | 690 | "Year in review" pieces citing the study |
| Dec 2025 | 74 | 764 | Year-end roundups |
| Jan 2026 | 76 | 840 | New year planning content, updated re-promotion |
Notice the September through November surge. We did a deliberate re-seeding campaign in late August, timed to the annual planning season when operations leaders are budgeting for the following year. Sending updated data — we ran a small pulse survey of 200 respondents in August to see if the numbers had shifted — gave us a reason to reach back out to journalists and newsletter writers who had covered us in spring. Five of them ran a follow-up mention. That follow-up mention cycle generated 140 of the 840 total linking domains.
The lesson: research assets have two lifecycles. The initial launch window (month one through three) and the strategic re-promotion window you engineer six to nine months later. Most teams invest everything in launch and then treat the asset as archived. That's leaving roughly 20 to 30% of the total link potential on the table.
The PRISM Framework: My Personal Process for Research-Led Link Acquisition
After running this campaign — and three similar ones in the 18 months prior — I've codified how I approach original research as an SEO strategy into a framework I call PRISM.
- P — Population Design. Who are you surveying, and can they be reached at scale? A poorly defined population produces data that nobody trusts. Define inclusion criteria before you write a single survey question.
- R — Resonance Hypothesis. Before you write the survey, write the headline you want to earn. Work backward from the finding. This isn't p-hacking; it's ensuring your questions are capable of producing data that's editorially interesting.
- I — Infrastructure First. The landing page, the structured data, the ClaimReview markup, the citation tracking pixels — all of this needs to be built before you publish, not after you're scrambling to handle inbound links.
- S — Seeding Architecture. Map your distribution before launch. Who are the 15 to 20 journalists, newsletter operators, and podcast hosts who will receive the study under embargo three days before public release? What's your LinkedIn activation plan for your client's internal network?
- M — Multi-Wave Momentum. Plan your re-promotion at month seven. Build the pulse survey into the project budget. Treat the first wave as the opening chapter, not the whole book.
PRISM isn't complicated. But running through each letter forces a discipline that most content teams skip. Specifically, most teams skip I and M. They publish the PDF, forget the structured markup, and never return to the asset. Then they wonder why the link curve flattened after month four.
On Population Design Specifically
This is where I spend more time than clients expect. The population definition determines whether journalists trust your numbers. If you survey "marketing professionals" at companies of "all sizes," your data is too diffuse to be actionable. If you survey "RevOps directors and VP-level operations leaders at B2B SaaS companies with 100 to 5,000 employees," your data is specific enough that people who serve that audience will cite it, because it reflects their exact readership or customer base.
The 1,247 sample size wasn't an accident. We needed enough respondents to run cross-tabs by company size, region, and role without cells smaller than 50 respondents. Anything smaller than that and your subgroup findings become statistically thin and journalists will call them out. We had 847 in wave one and knew we needed more DACH representation, so we added 400 in wave two. The final dataset held up to scrutiny.
$14,000 to Produce. Here's Every Line Item.
Transparency is a core part of why this section exists. I see a lot of content marketing articles that wave at "original research" as a strategy without ever discussing what it actually costs. That lack of specificity is itself a form of intellectual dishonesty — it makes the strategy sound more accessible than it is, or more expensive than it is, depending on which direction you're rounding.
Here's the actual budget breakdown for this project:
- Survey panel (two waves, 1,247 qualified respondents): $5,800
- Survey design and questionnaire consulting (external methodologist, 6 hours): $1,200
- Data cleaning, cross-tab analysis, statistical review: $900
- Report design (PDF + HTML interactive version): $2,400
- Copywriting and editorial (research narrative, 5,800 words): $1,800
- PR seeding and outreach (50 targets, personalized pitches): $1,100
- Structured data implementation and citation tracking setup: $400
- Pulse survey (August re-promotion wave, 200 respondents): $400
- Total: $14,000
What this doesn't include: the internal time my client's team spent coordinating the survey distribution through their existing customer list (they had opt-in research panel customers who supplemented our third-party panel). Nor does it include the time spent on LinkedIn promotion. If you added those at market rate, you'd add roughly $2,500.
For context, this client was previously spending approximately $6,000 per month on content production that was not generating meaningful links. The research study cost $14,000 once and generated a link profile that would have cost well over $50,000 to replicate through outreach-only campaigns, if it could be replicated at all, which it couldn't, because you can't replicate data ownership through outreach.
The Mistake I Made (And What It Cost Us in the First 30 Days)
I launched the report without a proper embargo strategy for the most important 10 journalists on the list.
I sent the report to all 50 outreach targets on the same day we published publicly. I thought this was efficient. It was not. The journalists who needed time to write something meaningful — the ones at trade publications who do actual reporting — had no lead time. Several of them came back to say they'd have covered it if they'd had two or three days before public release. By the time they saw my pitch, the story had already been broken by the newsletter writers who move faster and need less lead time.
We still got 47 links in month one. But looking at the link quality distribution, month one is the weakest. The high-DR trade press links we should have earned in month one didn't come until month three and four, after those journalists had seen the study referenced elsewhere and decided it was worth covering retroactively. That three-week delay in high-authority coverage probably cost us 60 to 80 links from publications that tend to cluster their coverage around an initial breaking story. Once they feel like they've missed the news window, many won't return.
The fix is simple. For any research asset, send to your top 10 targets under embargo 72 hours before public release. For longer-form journalists at major trade publications, extend that to five or six days. Let them break the story in their space.
This is basic PR craft. I knew it. I skipped it because we were under time pressure to hit a client deadline. I'm telling you because the lesson is more useful than the cover-up would be.
Contrarian Take #2: Primary Data Is the Only Defensible Moat Left in SEO Content
We are in a moment where the output cost of content has collapsed to near zero. Any reasonably capable AI tool can produce a 2,000-word article on a given topic in under three minutes. This is not news to anyone reading this piece. What I think is underweighted in discussions about the implications: if output cost is zero, then content that competes purely on production quality or comprehensiveness has no moat at all.
Link-worthy content used to win on depth. Then on format. Then on visual design. Each of those edges lasted a few years before they were commoditized. Primary data is different.
You cannot prompt an AI to generate survey data. The data either exists, because a human being collected it, or it doesn't. When a journalist is fact-checking a piece and needs a citation for "how many operations leaders say they have unused software subscriptions," there are two options: a source that ran the survey, and everything else. If you ran the survey, you are the citation. You are the link. Permanently, unless someone runs the same survey with better methodology, which takes them the same resources it took you.
I've seen this framed as "data journalism for B2B." That's accurate but undersells the SEO mechanism. The SEO mechanism is simple: journalists and writers need citations. Citations require sources. Sources that are unique are cited more. Unique data is the most unique source type that exists. Therefore, unique data generates more citations per unit of distribution effort than any other content type. That's the whole argument.
Link building through content that contains no original data is getting harder every quarter. Not because Google changed an algorithm. Because the supply of non-original content has expanded so fast that there's no reason to link to your version over anyone else's version. Original data breaks the tie. It doesn't just win the tie. It removes the competition entirely.
See also how this connects to topical authority building — building content hubs around owned data creates a gravity well that pulls in relevant links over time. And it intersects with digital PR in ways worth examining — the best editorial links in 2026 almost always trace back to a statistic nobody else owns.
Structuring Your Research Asset: Schema, ClaimReview, and Citation Tracking
This is the section most research-led SEO guides skip entirely, which is why most research-led SEO campaigns underperform on Google's ability to surface them as sources in AI Overviews, featured snippets, and the citation layers of generative search engines.
When you publish a research asset, you need three layers of technical infrastructure working together.
Layer 1: Dataset Schema
Marking up your study as a Dataset with proper JSON-LD tells Google exactly what this page represents. It's not a blog post. It's a primary source. Here's the core structure we used:
{
  "@context": "https://schema.org",
  "@type": "Dataset",
  "name": "B2B Workflow Automation Adoption and Waste Study 2025",
  "description": "A two-wave survey of 1,247 operations managers, RevOps leads, and IT directors examining automation tool adoption, utilization rates, and budget waste at companies with 200–2,000 employees.",
  "url": "https://example.com/research/automation-waste-study-2025",
  "sameAs": "https://doi.org/10.XXXXX/example",
  "license": "https://creativecommons.org/licenses/by/4.0/",
  "isAccessibleForFree": true,
  "creator": {
    "@type": "Organization",
    "name": "[Client Organization Name]",
    "url": "https://example.com"
  },
  "author": {
    "@type": "Person",
    "name": "[Lead Researcher Name]",
    "sameAs": "https://linkedin.com/in/example"
  },
  "datePublished": "2025-02-14",
  "dateModified": "2025-09-03",
  "temporalCoverage": "2024-10/2025-01",
  "spatialCoverage": {
    "@type": "Place",
    "name": "North America, United Kingdom, DACH Region"
  },
  "measurementTechnique": "Online survey panel, two-wave methodology with gap analysis",
  "variableMeasured": [
    {
      "@type": "PropertyValue",
      "name": "Unused software subscription rate",
      "value": "67",
      "unitText": "percent of respondents"
    },
    {
      "@type": "PropertyValue",
      "name": "Median monthly waste per company",
      "value": "1340",
      "unitText": "USD"
    },
    {
      "@type": "PropertyValue",
      "name": "Respondents without formal evaluation process",
      "value": "41",
      "unitText": "percent of respondents"
    }
  ],
  "size": "1247 respondents",
  "distribution": {
    "@type": "DataDownload",
    "encodingFormat": "application/pdf",
    "contentUrl": "https://example.com/research/automation-waste-study-2025.pdf"
  }
}
Layer 2: ClaimReview Markup for Key Statistics
For your top three or four headline findings, adding ClaimReview schema creates an additional indexable entity around each statistic. This is underused in content marketing. Here's how we structured it for the primary finding:
{
  "@context": "https://schema.org",
  "@type": "ClaimReview",
  "url": "https://example.com/research/automation-waste-study-2025#finding-unused-subscriptions",
  "claimReviewed": "67 percent of B2B operations teams pay for at least one automation tool their team has stopped using",
  "itemReviewed": {
    "@type": "Claim",
    "name": "Unused automation subscription prevalence",
    "author": {
      "@type": "Organization",
      "name": "[Client Organization Name]"
    },
    "datePublished": "2025-02-14",
    "appearance": {
      "@type": "OpinionNewsArticle",
      "url": "https://example.com/research/automation-waste-study-2025"
    }
  },
  "author": {
    "@type": "Organization",
    "name": "[Client Organization Name]",
    "url": "https://example.com"
  },
  "reviewRating": {
    "@type": "Rating",
    "ratingValue": "5",
    "bestRating": "5",
    "worstRating": "1",
    "alternateName": "True"
  },
  "languageCode": "en"
}
Layer 3: Citation Tracking Patterns
You want to know who is citing your research and where. The naive approach is to set up a Google Alert for the main statistic. The more robust approach involves a UTM-parameterized PDF download link combined with a JavaScript-based citation detector that fires when someone lands on your page with a referrer that indicates they came from a citation context. Here's the pattern we used:
// Citation tracking pattern — fires on page load
(function trackCitationReferral() {
  const referrer = document.referrer;
  const citationSignals = [
    /newsletter/i,
    /substack\.com/i,
    /beehiiv\.com/i,
    /substackcdn/i,
    /linkedin\.com\/posts/i,
    /t\.co\//i
  ];

  const isCitationReferral = citationSignals.some(pattern =>
    pattern.test(referrer)
  );

  if (isCitationReferral) {
    // Fire analytics event
    if (typeof gtag === 'function') {
      gtag('event', 'citation_referral', {
        'event_category': 'research_asset',
        'event_label': referrer,
        'referrer_domain': new URL(referrer).hostname
      });
    }

    // Log to custom endpoint for CRM enrichment
    fetch('/api/citation-signal', {
      method: 'POST',
      headers: { 'Content-Type': 'application/json' },
      body: JSON.stringify({
        referrer: referrer,
        timestamp: new Date().toISOString(),
        page: window.location.pathname
      })
    });
  }
})();
This pattern gave us visibility into citation referral traffic that doesn't show up cleanly in standard analytics. We identified 17 newsletters and 4 Substack writers who were generating repeated citation referrals before we had confirmed inbound links from those domains, which let us reach out proactively to those writers and offer updated data before they moved on to a new topic.
For a deeper look at how citation tracking intersects with AI-sourced traffic — the mechanics of measuring when Perplexity and ChatGPT Search cite your research are slightly different and worth setting up separately.
4.2x ROI: Doing the Math Honestly
I want to be transparent about how I calculated the 4.2x figure, because "ROI" in SEO campaigns is almost always either a black box or a number reverse-engineered to justify the project.
We measured ROI across three dimensions.
Dimension 1: Link value equivalent. Using the client's historical cost-per-acquired-referring-domain from their previous link building campaigns (outreach-based, editorial), the average cost was $67 per referring domain. 840 linking domains at $67 each = $56,280 in equivalent link-building spend. Against a $14,000 production cost, that alone is a 4.0x return.
Dimension 2: Organic traffic value. The research landing page itself ranks for 34 keywords, drives approximately 2,200 monthly organic sessions, and contributes to the client's topical authority across the automation category. Attributing conservatively using their blended customer LTV and conversion rates, organic traffic from the research hub contributed an estimated $4,800 in pipeline-influenced revenue over 12 months.
Dimension 3: Brand and category authority. This is the one I can't fully quantify. The client's brand is now cited in at least three trade publication pieces as a research source in their category. That's a positioning shift that compounds over time in ways that don't appear cleanly in a 12-month ROI calculation. I've excluded it from the 4.2x number rather than inflate it with soft attribution.
Total measured return: $56,280 (link equivalents) + $4,800 (organic traffic revenue) = $61,080. Against $14,000 invested: 4.36x, which I round to 4.2x to leave room for methodological imprecision.
This is the kind of calculation you can actually present to a CFO — it uses their cost basis, not ours, and it's conservative in what it includes.
What Comes Next in Research-Led SEO
I'm tracking three developments that will change how original research functions as an SEO asset in the next 18 to 24 months.
AI citation systems are developing a preference for structured, citable data. When Perplexity or ChatGPT Search pulls a statistic into a response, the probability that it links to a source correlates with how well that source's data is structured and attributed. Research assets with proper Dataset schema, methodology transparency, and named authors outperform anonymous data dumps in AI citation contexts. We saw early evidence of this with our study — it was cited in at least 14 AI-generated responses we could identify through our citation tracking setup. Schema.org's Dataset specification has expanded significantly in the past 18 months specifically to accommodate this use case.
Survey panels are getting more expensive and more scrutinized. The days of cheap panel responses where 30% of respondents are bots or disengaged clickers are colliding with an audience that is increasingly capable of identifying bad data. Your methodology section needs to be as carefully written as your findings. Include attention checks, completion time filtering, and open-text response review. Journalists at serious publications are now asking for methodology appendices before they'll cover a study.
The regulatory environment around data collection is tightening. GDPR enforcement in EU contexts is increasingly reaching across the Atlantic. If any of your survey respondents are EU-based — and if you're surveying B2B practitioners in DACH or UK, they will be — your survey consent flows, data retention policies, and privacy notices need to be airtight. This is not an SEO issue until it becomes a PR issue, at which point it erases the linking-domain gains very quickly.
The fundamental dynamic is not going to change. Journalists need citations. Citations require sources. Unique data is uniquely citable. That holds regardless of what AI does to the SERP, regardless of what the next core update targets, regardless of whether the next wave of content automation makes everything else free to produce.
The $14,000 we spent on this study bought something that most SEO budgets simply don't buy: a permanent advantage in citation competition. Every article written on automation tool adoption in the B2B mid-market for the next two to three years is going to either cite our study or explain why they didn't. That's not a content asset. That's a category position. And you cannot optimize your way into that position with a cleverer meta description.
Run the survey. Own the data. Everything else follows.
Frequently Asked Questions
How many respondents do you need for a B2B survey to be credible to journalists?
For a general B2B audience, 500+ respondents gives you enough for basic cross-tabulation and passes the sniff test at most trade publications. For audience-specific research where you're making subgroup claims (by company size, role, region), aim for 1,000+ total respondents so that no cross-tab cell falls below 50. At 1,247 respondents, our study could support subgroup analysis with confidence. Below 300 respondents, expect serious journalists to question statistical validity.
What is the cheapest way to field a B2B survey for original research?
The lowest-cost route is leveraging your client's existing email list or customer base as survey respondents, supplemented with social promotion. This can reduce panel costs to near zero but introduces selection bias (you're only reaching people who already know the brand). For link-building purposes, this bias is often acceptable if disclosed in methodology. If you need an external panel, providers like Dynata, Lucid, and Cint vary significantly in price — expect $4 to $8 per qualified B2B respondent depending on targeting specificity.
How long does a research-based link building asset continue to earn links?
Based on this campaign and comparable projects, the earning curve typically looks like: heavy front-loading in months one through three, tapering through month six, a secondary bump if you run a re-promotion or update campaign, and then a long tail of two to four links per month for years afterward as the study becomes embedded in category reference material. Studies with specific, memorable statistics — the kind people repeat in conversation — tend to earn passively for longer than studies whose findings require context to be meaningful.
Should research reports be gated (email required) or ungated?
For SEO and link acquisition purposes, ungated wins. Every gate reduces the probability of a journalist or writer linking to your study — they won't direct their readers to a page that asks for an email address before revealing data. The SEO benefit of an ungated, freely crawlable research asset will outperform the lead generation benefit of gating in most B2B contexts. If lead gen is a hard requirement, build an ungated summary page with all headline findings, full methodology, and a gated full-PDF download. Journalists link to the summary. Buyers download the PDF.
Does the PRISM framework apply to research assets other than surveys?
Yes. The PRISM framework (Population Design, Resonance Hypothesis, Infrastructure First, Seeding Architecture, Multi-Wave Momentum) applies equally well to proprietary data analyses (scraping public records, analyzing your platform's anonymized usage data), expert consensus studies (Delphi method), and longitudinal tracking studies. The "Population Design" step translates to "data source definition" for non-survey research. The core principle — that primary data you control permanently positions you as the citable source — holds regardless of the collection method.