Most growth teams in 2026 still operate like it's 2015: SEO owns rankings and traffic, CRO owns conversion rate, and the two disciplines share little more than a quarterly all-hands slide. The result is predictable — you drive thousands of organic sessions to a landing page that leaks 97% of visitors, celebrate a top-3 ranking, and wonder why revenue isn't moving. Meanwhile, the CRO team runs A/B tests on pages that receive negligible organic traffic and cannot attribute wins to search intent segments.
This is a structural failure, not a talent problem. When SEO and CRO operate in silos, you optimize the wrong variables in the wrong order. SEO without CRO scales a broken funnel. CRO without SEO optimizes pages that may lose traffic the moment a core update hits. The compounding value of integrating both disciplines — sharing data, aligning hypotheses, and closing the feedback loop — is one of the highest-leverage plays available to a senior growth strategist today.
This guide is a practitioner-level playbook: data architecture, experiment design, tooling (VWO, Optimizely, AB Tasty, GA4, Hotjar, Clarity), and a decision framework for prioritizing where integrated optimization delivers the most value. We'll cover the full stack — from BigQuery joins between Google Search Console and GA4 to GTM dataLayer patterns for passing search intent signals into A/B testing layers.
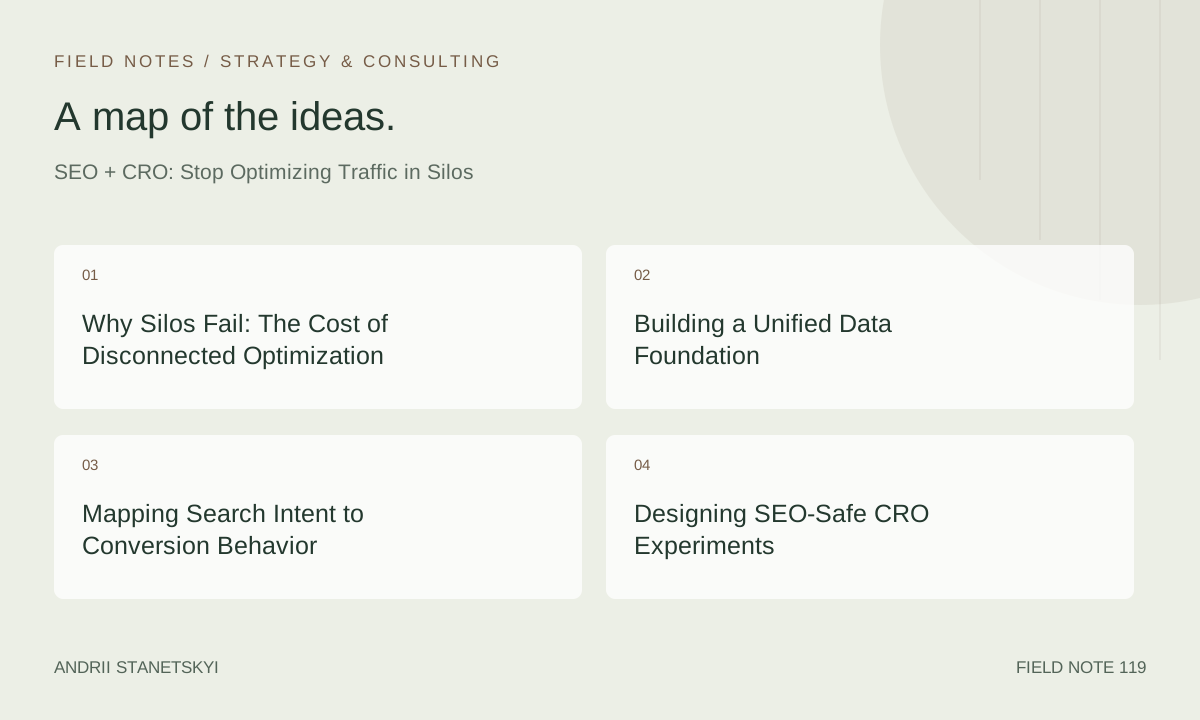
Why Silos Fail: The Cost of Disconnected Optimization
Consider a SaaS company ranking #2 for a high-intent keyword driving 12,000 monthly sessions to a feature comparison page. The SEO team's job is done — the ranking is excellent. But the CRO team has never touched that page because it sits outside their "high-traffic" threshold for experimentation (they focus on paid landing pages). The page converts at 1.2%. A modest lift to 2.4% doubles pipeline from that single asset without acquiring a single additional click.
This scenario plays out across verticals. E-commerce sites invest heavily in technical SEO for category pages while CRO teams focus exclusively on product detail pages and checkout. B2B firms produce thought-leadership content that ranks well but has no conversion architecture whatsoever — no micro-conversion hooks, no progressive profiling, no session-value instrumentation.
The silo also creates analytical blind spots. SEO teams cannot see which keyword segments actually convert downstream (GA4 referral data is fragmented; GSC doesn't expose post-click behavior). CRO teams run experiments without controlling for organic traffic fluctuations — a 15% swing in branded vs. non-branded organic mix can invalidate an A/B test result that looks clean on the surface.
Building a Unified Data Foundation
Joining GSC and GA4 in BigQuery
The first infrastructure step is connecting Google Search Console data to GA4 behavioral data in BigQuery. GSC's Search Analytics API exposes query, page, clicks, impressions, and position. GA4 BigQuery exports expose session-level and event-level behavior. The join key is the landing page URL and date.
-- GSC + GA4 BigQuery join: organic session value by query cluster
WITH gsc_data AS (
  SELECT
    query,
    page,
    SUM(clicks) AS organic_clicks,
    AVG(position) AS avg_position,
    SUM(impressions) AS impressions,
    DATE(data_date) AS date
  FROM project.dataset.searchconsole_site_report_by_page
  WHERE data_date BETWEEN DATE_SUB(CURRENT_DATE(), INTERVAL 30 DAY) AND CURRENT_DATE()
  GROUP BY query, page, date
),
ga4_sessions AS (
  SELECT
    REGEXP_REPLACE(
      (SELECT value.string_value FROM UNNEST(event_params) WHERE key = 'page_location'),
      r'\?.*', ''
    ) AS page,
    DATE(TIMESTAMP_MICROS(event_timestamp)) AS date,
    user_pseudo_id,
    (SELECT value.int_value FROM UNNEST(event_params) WHERE key = 'session_engaged') AS engaged,
    -- session value via purchase or lead event revenue
    (SELECT value.double_value FROM UNNEST(event_params) WHERE key = 'value') AS session_value
  FROM project.dataset.events_*
  WHERE _TABLE_SUFFIX BETWEEN FORMAT_DATE('%Y%m%d', DATE_SUB(CURRENT_DATE(), INTERVAL 30 DAY))
    AND FORMAT_DATE('%Y%m%d', CURRENT_DATE())
    AND traffic_source.medium = 'organic'
    AND event_name IN ('session_start', 'purchase', 'generate_lead')
),
session_aggregates AS (
  SELECT
    page,
    date,
    COUNT(DISTINCT user_pseudo_id) AS organic_sessions,
    SUM(session_value) AS total_session_value,
    AVG(session_value) AS avg_session_value
  FROM ga4_sessions
  GROUP BY page, date
)
SELECT
  g.query,
  g.page,
  g.organic_clicks,
  g.avg_position,
  s.organic_sessions,
  s.avg_session_value,
  SAFE_DIVIDE(s.total_session_value, g.organic_clicks) AS revenue_per_click,
  -- Intent signal: high position + low session value = CRO opportunity
  CASE
    WHEN g.avg_position <= 5 AND s.avg_session_value < 2.0 THEN 'HIGH_PRIORITY_CRO'
    WHEN g.avg_position <= 10 AND s.avg_session_value BETWEEN 2.0 AND 5.0 THEN 'MEDIUM_PRIORITY'
    ELSE 'MONITOR'
  END AS optimization_priority
FROM gsc_data g
LEFT JOIN session_aggregates s ON g.page = s.page AND g.date = s.date
ORDER BY g.organic_clicks DESC;
This query surfaces the highest-leverage CRO opportunities in your organic footprint: pages that already rank well (low position number), drive significant click volume, but return below-average session value. These are your first-pass targets.
GTM DataLayer: Passing Intent Signals to Your Testing Layer
Once you identify intent segments from GSC, you need to pass that signal into your A/B testing platform at runtime. GTM is the bridge. The following pattern reads the UTM or referral data, infers intent tier, and pushes it into the dataLayer so VWO, Optimizely, or AB Tasty can use it as an audience condition.
// GTM Custom JavaScript Variable: organic_intent_tier
function() {
  var ref = document.referrer || '';
  var params = new URLSearchParams(window.location.search);

  // Grab keyword from URL param if present (e.g., Google Ads preview or GSC click simulation)
  var keyword = params.get('kw') || params.get('keyword') || '';

  // Read stored intent from sessionStorage if set by server-side middleware
  var storedIntent = sessionStorage.getItem('seo_intent_tier');
  if (storedIntent) return storedIntent;

  // Fallback: classify by referrer pattern
  if (ref.indexOf('google') !== -1 || ref.indexOf('bing') !== -1) {
    // Use page path as a proxy for content type
    var path = window.location.pathname;
    if (/\/(pricing|demo|trial|buy|checkout)/.test(path)) return 'commercial';
    if (/\/(blog|guide|what-is|how-to)/.test(path)) return 'informational';
    if (/\/(vs|compare|alternative|review)/.test(path)) return 'comparison';
    return 'organic_unknown';
  }
  return 'non_organic';
}

// GTM Tag: Push intent tier to dataLayer on DOM Ready
dataLayer.push({
  'event': 'seo_intent_classified',
  'seo_intent_tier': {{JS - organic_intent_tier}},
  'organic_landing_page': window.location.pathname,
  'session_start_timestamp': Date.now()
});
With this dataLayer event firing, your testing platform can segment experiment arms by intent tier. A visitor arriving on a comparison page gets a variant emphasizing feature differentiation. A visitor on a how-to guide gets a softer micro-conversion CTA rather than a direct demo request — dramatically improving form completion rates without changing the page's topical relevance to Google.
Mapping Search Intent to Conversion Behavior
The Four-Intent Conversion Architecture
Not all organic traffic converts the same way, and designing a single conversion experience for all intent types is the core mistake. A four-tier intent model maps directly to conversion architecture decisions:
Informational intent (how-to, what-is, guide queries): Primary goal is micro-conversion — email capture, content upgrade, tool usage, or scroll depth that signals qualified engagement. Pushing a demo CTA on an informational page tanks both conversion rate and dwell time signals.
Investigational intent (best X, top Y, reviews): Users are evaluating options. Social proof density, comparison tables, and trust signals are the primary conversion levers. Micro-conversion: comparison tool interaction, "save to shortlist" action, or review filter usage.
Commercial intent (pricing, buy, demo, trial): Users are ready to act. Friction reduction is the primary lever — fewer form fields, one-click SSO sign-up, chat availability, and strong urgency signals (trial expiry, seat limits).
Navigational intent (branded queries): These sessions have the highest baseline conversion intent. CRO focus: eliminate exit opportunities, ensure consistent messaging from ad/organic snippet to landing page, and surface account-based personalization where possible.
Designing SEO-Safe CRO Experiments
What Can Break Rankings During A/B Tests
Running CRO experiments on high-ranking pages without guardrails can trigger ranking instability. The primary risks: serving different HTML to Googlebot vs. users (cloaking), diluting page authority by splitting traffic across variant URLs without proper canonical handling, and changing core page content that anchors keyword relevance.
Best practices for SEO-safe experimentation:
- Always serve the same variant to Googlebot that you serve to the majority of users (or the control). Most client-side testing platforms (VWO, Optimizely, AB Tasty) do this by default since they execute JavaScript after the initial HTML render.
- For URL-split tests (A/B with separate URLs), use
rel="canonical"pointing to the control URL on variant pages, and setnoindexon variants if the test runs for more than 2–3 weeks. - Monitor GSC Coverage and Performance reports for impression drops during active experiments. A statistically significant ranking drop during an experiment is a signal to pause and audit.
- Avoid changing H1 text, primary keyword density, or structured data markup in experiment variants — these are Googlebot-visible even in client-side tests if the initial HTML contains them.
GA4 Event Snippet: Micro-Conversion Tracking for CRO Experiments
// GA4 micro-conversion events for SEO-CRO integrated pages
// Fire these via GTM or directly in page JS

// 1. Content engagement depth (for informational pages)
gtag('event', 'content_engagement', {
  'content_type': 'seo_guide',
  'intent_tier': 'informational',
  'scroll_depth_pct': 75,
  'time_on_page_sec': 180,
  'experiment_id': 'VWO_EXP_4471',
  'experiment_variant': 'B_sticky_cta',
  'session_value': 0.0  // updated on downstream conversion
});

// 2. CTA interaction (tracks which variant CTA triggered engagement)
gtag('event', 'cta_interaction', {
  'cta_type': 'inline_demo_request',
  'page_intent': 'comparison',
  'experiment_variant': 'B_sticky_cta',
  'organic_keyword_cluster': 'crm_software_comparison',
  'value': 4.50  // estimated micro-conversion value from historical LTV data
});

// 3. Form start (high-signal micro-conversion, precedes submission)
gtag('event', 'form_start', {
  'form_id': 'demo_request_sidebar',
  'experiment_id': 'OPT_EXP_2891',
  'traffic_source_medium': 'organic',
  'intent_tier': 'commercial',
  'value': 12.00
});

// 4. Session value update on downstream goal completion
gtag('event', 'session_value_update', {
  'goal': 'lead_qualified',
  'value': 85.00,
  'currency': 'USD',
  'experiment_id': 'ABT_EXP_0312',
  'experiment_variant': 'control'
});
Tooling Stack: GA4, VWO, Optimizely, AB Tasty, Hotjar, Clarity
VWO and Optimizely: Intent-Based Audience Segmentation
Both VWO and Optimizely support custom JavaScript conditions for audience targeting. With the GTM dataLayer pattern above, you can create audience segments in VWO using window.dataLayer lookups or custom dimensions. In Optimizely, use the Attributes API to pass seo_intent_tier as an experiment attribute, enabling post-hoc segmentation in results even if you don't pre-segment traffic.
AB Tasty's Audience Builder supports URL pattern matching and referrer conditions natively — useful for quickly isolating organic traffic without GTM instrumentation. For high-traffic organic pages, AB Tasty's feature flagging layer allows you to run server-side experiments that are completely invisible to crawlers, eliminating the cloaking risk entirely.
Heatmaps: Hotjar and Microsoft Clarity for Organic-Specific Behavioral Analysis
Heatmap tools provide qualitative evidence that BigQuery joins cannot. Before designing an experiment hypothesis for a high-ranking page, run Hotjar or Clarity with an organic-traffic filter active for 2–4 weeks. The typical findings on SEO-driven pages:
- Users scroll past conversion elements because informational content trains them to expect more content below the fold before a CTA appears.
- Rage clicks concentrate on non-interactive elements that look like CTAs (colored callout boxes, underlined text in body copy).
- Session recordings reveal pogo-sticking patterns — users who arrived via a specific keyword cluster exit to refine their search if the above-the-fold content doesn't immediately confirm they've found what they searched for.
Microsoft Clarity's free tier includes session recordings with rage-click and dead-click filters, making it particularly cost-effective for initial organic page audits. Hotjar's AI-powered heatmap summaries (introduced in 2025) can classify interaction patterns by traffic source if you configure custom user attributes. See also: [internal: organic UX audit framework] for a step-by-step behavioral audit process.
Prioritization Framework: Traffic Value vs. Conversion Lift Matrix
Not all pages deserve integrated optimization effort. Use this matrix to triage your organic page inventory. Score each dimension 1–5 based on the criteria below, then multiply for a composite priority score.
| Page / Cluster | Organic Monthly Sessions | Avg. Position (GSC) | Current CVR | Estimated CVR Ceiling | Traffic Value Score (1–5) | Conversion Lift Potential (1–5) | Priority Score | Recommended Action |
|---|---|---|---|---|---|---|---|---|
| Pricing page (commercial intent) | 8,200 | 3.1 | 1.8% | 4.5% | 5 | 5 | 25 | Full experiment program (VWO/Optimizely) |
| Comparison page (investigational) | 12,400 | 4.7 | 0.9% | 2.8% | 5 | 4 | 20 | Heatmap + experiment on social proof block |
| How-to guide (informational) | 34,000 | 2.3 | 0.2% | 1.5% | 5 | 3 | 15 | Micro-conversion architecture (email/tool) |
| Feature page (commercial) | 3,100 | 7.8 | 2.1% | 3.9% | 3 | 4 | 12 | SEO lift first, then CRO |
| Blog post cluster (informational) | 18,000 | 6.2 | 0.1% | 0.8% | 4 | 2 | 8 | Content upgrade / nurture sequence |
| Long-tail FAQ pages (informational) | 2,200 | 9.4 | 0.3% | 0.6% | 2 | 1 | 2 | Monitor only — invest in rankings first |
Traffic Value Score criteria: 5 = >10K sessions AND avg position ≤5; 4 = >10K sessions OR avg position ≤5; 3 = 3–10K sessions, position 5–10; 2 = 1–3K sessions; 1 = <1K sessions.
Conversion Lift Potential criteria: 5 = current CVR less than 50% of category benchmark AND heatmap shows obvious friction; 4 = current CVR 50–70% of benchmark; 3 = CVR at benchmark, lift possible via personalization; 2 = CVR above benchmark but room exists; 1 = CVR at ceiling or traffic intent too low for meaningful conversion.
For a deeper look at how session value translates to experiment prioritization, review [internal: session value calculation guide] and the [external: CXL Institute experimentation curriculum] for statistical rigor frameworks.
Case Studies and Step-by-Step Walkthroughs
Case Study 1: B2B SaaS Comparison Page — 2.1x Conversion Lift
A project management SaaS platform had a "vs. Competitor" comparison page ranking position 2 for a 6,800 monthly search volume keyword. GSC showed 3,400 monthly clicks. GA4 showed a 0.6% demo request rate — well below the 1.8% category benchmark for commercial-intent comparison pages.
Step 1 — Behavioral audit: Hotjar session recordings (filtered to organic, desktop) revealed that 68% of users scrolled directly to the feature comparison table and ignored the above-the-fold hero section entirely. The demo CTA was only present in the hero and footer.
Step 2 — Hypothesis: Anchoring a secondary sticky CTA bar that appears after users scroll past 30% of the comparison table will capture high-intent micro-conversions without disrupting the content experience.
Step 3 — Experiment setup in VWO: Variant B added a sticky bottom bar ("See how [Product] compares in your workflow — Book a 15-min demo") that triggered at 30% scroll depth. Audience condition: organic traffic only (referrer match). Duration: 4 weeks. Primary metric: demo request form starts. Secondary metric: session value from GA4 custom dimension.
Step 4 — Results: Variant B produced a 2.1x lift in demo form starts (0.6% → 1.26%) at 96% statistical significance. GSC impressions and clicks were flat across the experiment window, confirming no ranking impact. Revenue attribution via Salesforce integration showed a 31% increase in pipeline from the page over the following 60 days.
Case Study 2: E-Commerce Category Page — Micro-Conversion Funnel for Informational Traffic
A home goods retailer had a "how to choose a mattress" guide ranking #1 for multiple informational queries driving 28,000 monthly sessions. Purchase CVR was 0.08% — expected for informational intent — but the team was leaving significant nurture value on the table.
Step 1 — Intent analysis: BigQuery join showed that sessions arriving on the guide page from informational queries had a 22-day average path to purchase when they converted — far longer than the direct purchase path. The guide was the top-of-funnel entry for 34% of eventual buyers, but was invisible in attribution because last-click GA4 gave it zero credit.
Step 2 — Micro-conversion architecture: AB Tasty was used to test a "mattress match quiz" embedded mid-page (after the primary comparison content) against a control with only a standard product link CTA. The quiz was a 4-question flow leading to a personalized product recommendation with email capture.
Step 3 — Results: Quiz completion rate: 8.4% of organic visitors. Email capture rate from quiz completions: 61%. 30-day purchase rate from captured emails: 14% — compared to 0.08% direct from page. The micro-conversion architecture effectively transformed an informational page into a qualified lead generator without changing the SEO-relevant content structure.
Step-by-Step: Running Your First Integrated SEO-CRO Sprint
- Data pull (Day 1–2): Run the BigQuery GSC + GA4 join. Identify your top 10 pages by organic clicks with below-benchmark session value.
- Intent classification (Day 2–3): Classify each page by intent tier. Confirm via Clarity or Hotjar scroll maps that the current conversion architecture matches intent.
- Prioritization (Day 3): Score using the Traffic Value × Conversion Lift matrix. Select 2–3 pages for active experimentation.
- Hypothesis documentation (Day 4–5): Write structured hypotheses (If we [change X] for [organic visitors showing Y intent signal], then [metric Z] will improve by [N%] because [behavioral evidence]).
- GTM instrumentation (Day 5–7): Deploy intent tier dataLayer push. Verify in GTM Preview mode with GA4 DebugView.
- Experiment launch (Day 8): Configure audience segments in VWO/Optimizely/AB Tasty using dataLayer conditions. Set minimum sample size based on current traffic and expected lift.
- GSC monitoring (Weekly): Check GSC Performance report for impression/click changes on experiment pages. Flag deviations >15% for investigation.
- Results analysis (Post-experiment): Segment GA4 Explorations by experiment variant and intent tier. Validate statistical significance before declaring winners.
See also: [internal: A/B test statistical significance guide] and [internal: GA4 Explorations setup for experiment analysis].
-- GA4 Exploration query: experiment variant performance by intent tier
-- Run in BigQuery for deeper segmentation than GA4 UI allows

SELECT
  (SELECT value.string_value FROM UNNEST(event_params) WHERE key = 'experiment_id') AS experiment_id,
  (SELECT value.string_value FROM UNNEST(event_params) WHERE key = 'experiment_variant') AS variant,
  (SELECT value.string_value FROM UNNEST(event_params) WHERE key = 'intent_tier') AS intent_tier,
  event_name,
  COUNT(DISTINCT user_pseudo_id) AS unique_users,
  COUNT(*) AS event_count,
  SUM(
    (SELECT value.double_value FROM UNNEST(event_params) WHERE key = 'value')
  ) AS total_value,
  AVG(
    (SELECT value.double_value FROM UNNEST(event_params) WHERE key = 'value')
  ) AS avg_value_per_event
FROM project.dataset.events_*
WHERE _TABLE_SUFFIX BETWEEN '20260301' AND '20260428'
  AND event_name IN ('cta_interaction', 'form_start', 'session_value_update', 'purchase')
  AND (SELECT value.string_value FROM UNNEST(event_params) WHERE key = 'experiment_id') IS NOT NULL
GROUP BY experiment_id, variant, intent_tier, event_name
ORDER BY experiment_id, variant, total_value DESC;
For additional experiment pattern references, the [external: Nielsen Norman Group A/B testing guide] provides rigorous UX research methodology that complements the quantitative framework above.
See also: [internal: SEO experiment guardrails checklist] for pre-launch review criteria.
FAQ
Does running A/B tests on high-ranking pages risk hurting organic rankings?
Client-side A/B testing tools like VWO, Optimizely, and AB Tasty execute JavaScript after the initial HTML is rendered, so Googlebot typically sees the control version (original page content). The primary risk is inadvertent cloaking — serving fundamentally different content to bots vs. users. As long as your experiment doesn't change the core HTML content that Googlebot indexes (H1, body text, structured data), ranking risk is minimal. For URL-split tests, always apply rel="canonical" from variant URLs back to the control, and set a noindex directive on variants running longer than three weeks. Monitor GSC Performance daily during active experiments for any impression drops exceeding 15%.
How do I attribute organic traffic correctly when a user converts 20+ days after first touch?
GA4's data-driven attribution model handles multi-touch paths better than last-click, but it still underrepresents top-of-funnel organic touchpoints in long B2B sales cycles. The most reliable approach is a BigQuery-based path analysis: export all GA4 session data, group by user_pseudo_id, order by event timestamp, and tag each session with its traffic source. You can then build a first-touch, last-touch, and linear attribution model natively and compare. For e-commerce, GA4's Explorations "Path Exploration" report provides a reasonable approximation without custom SQL, though it caps path length at 10 events.
What sample size do I need before a CRO experiment on an organic page is statistically valid?
Statistical validity requires sufficient sample size per variant, which depends on your baseline conversion rate, expected minimum detectable effect (MDE), and desired significance level (typically 95%). For a page converting at 1% with an MDE of 20% (relative), you need approximately 20,000 sessions per variant. At 5,000 monthly organic sessions, that's a 4-month experiment window per variant — often impractical. Solutions: lower your MDE threshold (accept detecting only larger effects), use sequential testing methods available in Optimizely's Stats Engine, or focus CRO efforts on higher-traffic pages where you can reach significance in 2–4 weeks.
How should heatmaps be interpreted differently for organic vs. paid traffic?
Organic visitors, especially from informational queries, typically have higher scroll depth, longer time on page, and more diverse interaction patterns than paid visitors who arrive on purpose-built landing pages. When analyzing Hotjar or Clarity heatmaps, always filter to organic-only sessions before drawing conclusions. A click map that shows low CTA engagement may look alarming, but if 70% of organic sessions arrive from informational intent queries, the benchmark for direct CTA clicks is naturally lower. The meaningful signal is the ratio of scroll depth to CTA interaction — high scroll depth with zero CTA interaction indicates a content-to-conversion alignment problem, not a CTA design problem.
Can GA4 Explorations replace BigQuery for SEO-CRO analysis?
GA4 Explorations are sufficient for exploratory analysis and hypothesis generation but have meaningful limitations for rigorous SEO-CRO integration: sampling kicks in above 10M events in free GA4 (360 raises this threshold), there is no native GSC data join capability, custom dimensions are capped at 50 per property, and historical data is limited to 14 months. For production-grade analysis — especially the GSC + GA4 join that surfaces revenue-per-click by keyword — BigQuery export is necessary. GA4 Explorations is best used for quick iteration during experiment monitoring, while BigQuery handles the strategic prioritization layer.
How do I prevent CRO experiment variants from diluting page authority in internal link equity?
This is primarily a concern in URL-split tests, not client-side experiments. For URL-split tests, internal links should always point to the canonical control URL. Do not create new internal links pointing to variant URLs — these dilute PageRank without benefit since the variant should be noindexed. For client-side experiments, this issue doesn't apply since there is only one URL. The greater internal link equity concern in SEO-CRO integration is ensuring that CRO experiments don't accidentally modify anchor text or link structures in ways that change the topical signals the page sends to Google.
What is session value and how do I calculate it for organic traffic specifically?
Session value is the average revenue (or estimated revenue proxy) attributable to a single session. For e-commerce, GA4 computes this natively if you implement the purchase event with a value parameter — divide total purchase value by total sessions for the period. For B2B lead generation, you need to assign estimated values to micro-conversions based on historical conversion rates and average deal size (e.g., if 5% of demo requests become customers at $12,000 ACV, each demo request is worth $600; if 8% of guide readers request a demo, each guide session is worth $48). This estimated session value becomes the primary optimization metric in your BigQuery analysis and experiment reporting, replacing raw conversion rate as the decision variable — which accounts for both the probability and the magnitude of conversion.
Key Takeaways
- The highest-leverage growth opportunity for most organic-first businesses in 2026 is not more traffic — it is extracting more value from existing high-ranking pages through integrated CRO.
- The unified data foundation (GSC + GA4 in BigQuery) is the prerequisite infrastructure. Without it, you are optimizing based on incomplete signals.
- Intent tier classification (informational, investigational, commercial, navigational) must drive both the hypothesis and the success metric for every experiment — a single CVR metric cannot capture the difference between these intent contexts.
- Client-side A/B testing (VWO, Optimizely, AB Tasty) on organic pages is generally safe from an SEO perspective if you follow the SEO guardrails: no H1/body-content changes in variants, canonical tags on URL-split variants, and active GSC monitoring during experiments.
- Heatmaps (Hotjar, Clarity) filtered to organic-only traffic provide behavioral evidence that quantitative data cannot — use them to validate hypotheses before investing in experiment instrumentation.
- Session value — not raw conversion rate — should be the primary metric in your prioritization matrix and experiment reporting, as it accounts for both conversion probability and downstream revenue magnitude.
- Micro-conversions (email capture, quiz completion, tool usage, form starts) on informational pages unlock attribution visibility into long purchase cycles that last-click models systematically obscure.
- The GTM dataLayer intent-tier pattern is the integration layer between SEO data and your testing platform — it enables organic-traffic-specific audience conditions without requiring server-side implementation.
Conclusion
Integrated SEO and CRO is not a new idea — but in 2026, the tooling has matured to the point where there is no longer a credible technical reason to operate them separately. GA4 BigQuery exports, GSC API access, client-side testing platforms with JavaScript audience conditions, and free behavioral analysis tools like Clarity have collapsed the infrastructure barrier that once justified siloed teams.
What remains is an organizational and analytical challenge. SEO teams need to instrument session value and downstream revenue metrics, not just rankings and traffic. CRO teams need to understand that organic traffic segments require different experiment designs and success metrics than paid traffic. Both teams need shared access to the BigQuery dataset that joins their respective data sources.
The compounding returns are significant. A 2x conversion lift on a page driving 10,000 organic sessions per month is equivalent to doubling that page's ranking performance — without the time, content, and link-building investment that ranking improvement requires. At scale, a systematic integrated program running 6–8 experiments annually across your top organic pages can produce revenue impact that dwarfs the equivalent investment in incremental traffic acquisition.
Stop optimizing traffic in silos. The data infrastructure, the tooling, and the playbook exist. The only remaining constraint is execution.